


IoT | A estação meteorológica TensorFlow prevê a intensidade da chuva
Componentes e suprimentos
| × | 1 | ||||
 |
| × | 1 | |||
| × | 1 | ||||
 |
| × | 1 | |||
 |
| × | 1 | |||
 |
| × | 1 | |||
 |
| × | 2 |
Ferramentas e máquinas necessárias
 |
|
Aplicativos e serviços online
 |
| |||
 |
| |||
 |
|
Sobre este projeto
Especialmente em 2020, chuvas instantâneas fortes e violentas causaram efeitos prejudiciais nas estufas e na produtividade das safras em meu país. Infelizmente, hoje em dia, chuvas inesperadas e excessivas ocorrem com mais frequência e se tornaram relativamente comuns devido às mudanças climáticas em algumas áreas. Enquanto isso, outras regiões sofrem com a seca. No decorrer de 2020, mais de trinta e cinco incidentes que causaram a perda de colheitas e gado devido a chuvas fortes e violentas são registrados na minha região. Para contribuir com a solução para evitar e evitar o excesso de chuvas, instigado por problemas como a perda de produtividade agrícola, contemplei este projeto como ponto de partida.
Primeiramente, concentrei-me nos efeitos da chuva excessiva na agricultura neste projeto. No entanto, chuvas excessivas podem levar a vários perigos, por exemplo [1]:
- inundações, incluindo risco de vida humana,
- danos a edifícios e infraestrutura,
- perda de safras e gado,
- deslizamentos de terra, que podem ameaçar vidas humanas, atrapalhar o transporte e as comunicações.
Conforme mostrado nos estudos mais recentes, a precipitação excessiva pode afetar a produtividade da cultura de várias maneiras, incluindo danos físicos diretos, atraso no plantio e colheita, crescimento restrito da raiz, deficiência de oxigênio e perda de nutrientes. Assim, muita chuva pode ser tão perigosa quanto a seca para a agricultura: "Os dados das últimas três décadas sugerem que o excesso de chuva pode afetar a produtividade das safras tanto quanto o calor excessivo e a seca. Em um novo estudo, uma equipe interdisciplinar do A Universidade de Illinois vinculou dados de seguro de safra, clima, solo e produtividade de milho de 1981 a 2016. O estudo descobriu que, durante alguns anos, o excesso de chuvas reduziu a produtividade de milho dos EUA em até 34% em relação à produtividade esperada. Os dados sugerem que a seca e o calor excessivo causaram uma perda de rendimento de até 37% durante alguns anos [2] " .
Infelizmente, os sistemas de alerta precoce não são suficientes para prevenir inteiramente os efeitos exacerbantes da chuva excessiva sobre os produtos e processos agrícolas sem dados climáticos locais adequados e preliminares para cada estufa ou fazenda. Portanto, na esperança de evitar os efeitos prejudiciais do excesso de chuvas na agricultura, decidi criar este projeto como uma estação meteorológica remota econômica para coletar e interpretar informações meteorológicas locais para fazer previsões mais precisas sobre a intensidade da chuva.
Depois de fazer algumas pesquisas sobre aprendizado profundo e redes neurais, decidi construir uma rede neural artificial (RNA) baseada no modelo de classificação para interpretar os dados meteorológicos locais acumulados para prever a intensidade da chuva de acordo com as classes dadas. Como o estudo a seguir indica, os pesquisadores aplicaram diferentes modelos e tipos de rede neural para prever não apenas chuvas, mas também fenômenos meteorológicos: "Muitos experimentos usaram redes neurais para prever quantidades quantitativas de chuvas em vários locais e intervalos de previsão. Por exemplo, os pesquisadores da Tailândia conseguiram obter previsões altamente precisas usando redes neurais feed-forward para prever quantidades quantitativas de chuva no intervalo de uma a três horas, a fim de prever possíveis perigos de inundação. As redes neurais também foram usadas para prever fenômenos climáticos além dos valores de previsão tradicionais, como probabilidade / quantidade de chuva, velocidade do vento, pressão barométrica, etc. Eles têm sido usados com muito sucesso para prever tornados. Além disso, pesquisadores na Austrália usaram com sucesso uma rede neural para identificar nevoeiro em várias previsões varia de 3 a 18 horas em torno do Aeroporto Internacional de Canberra [3]. "
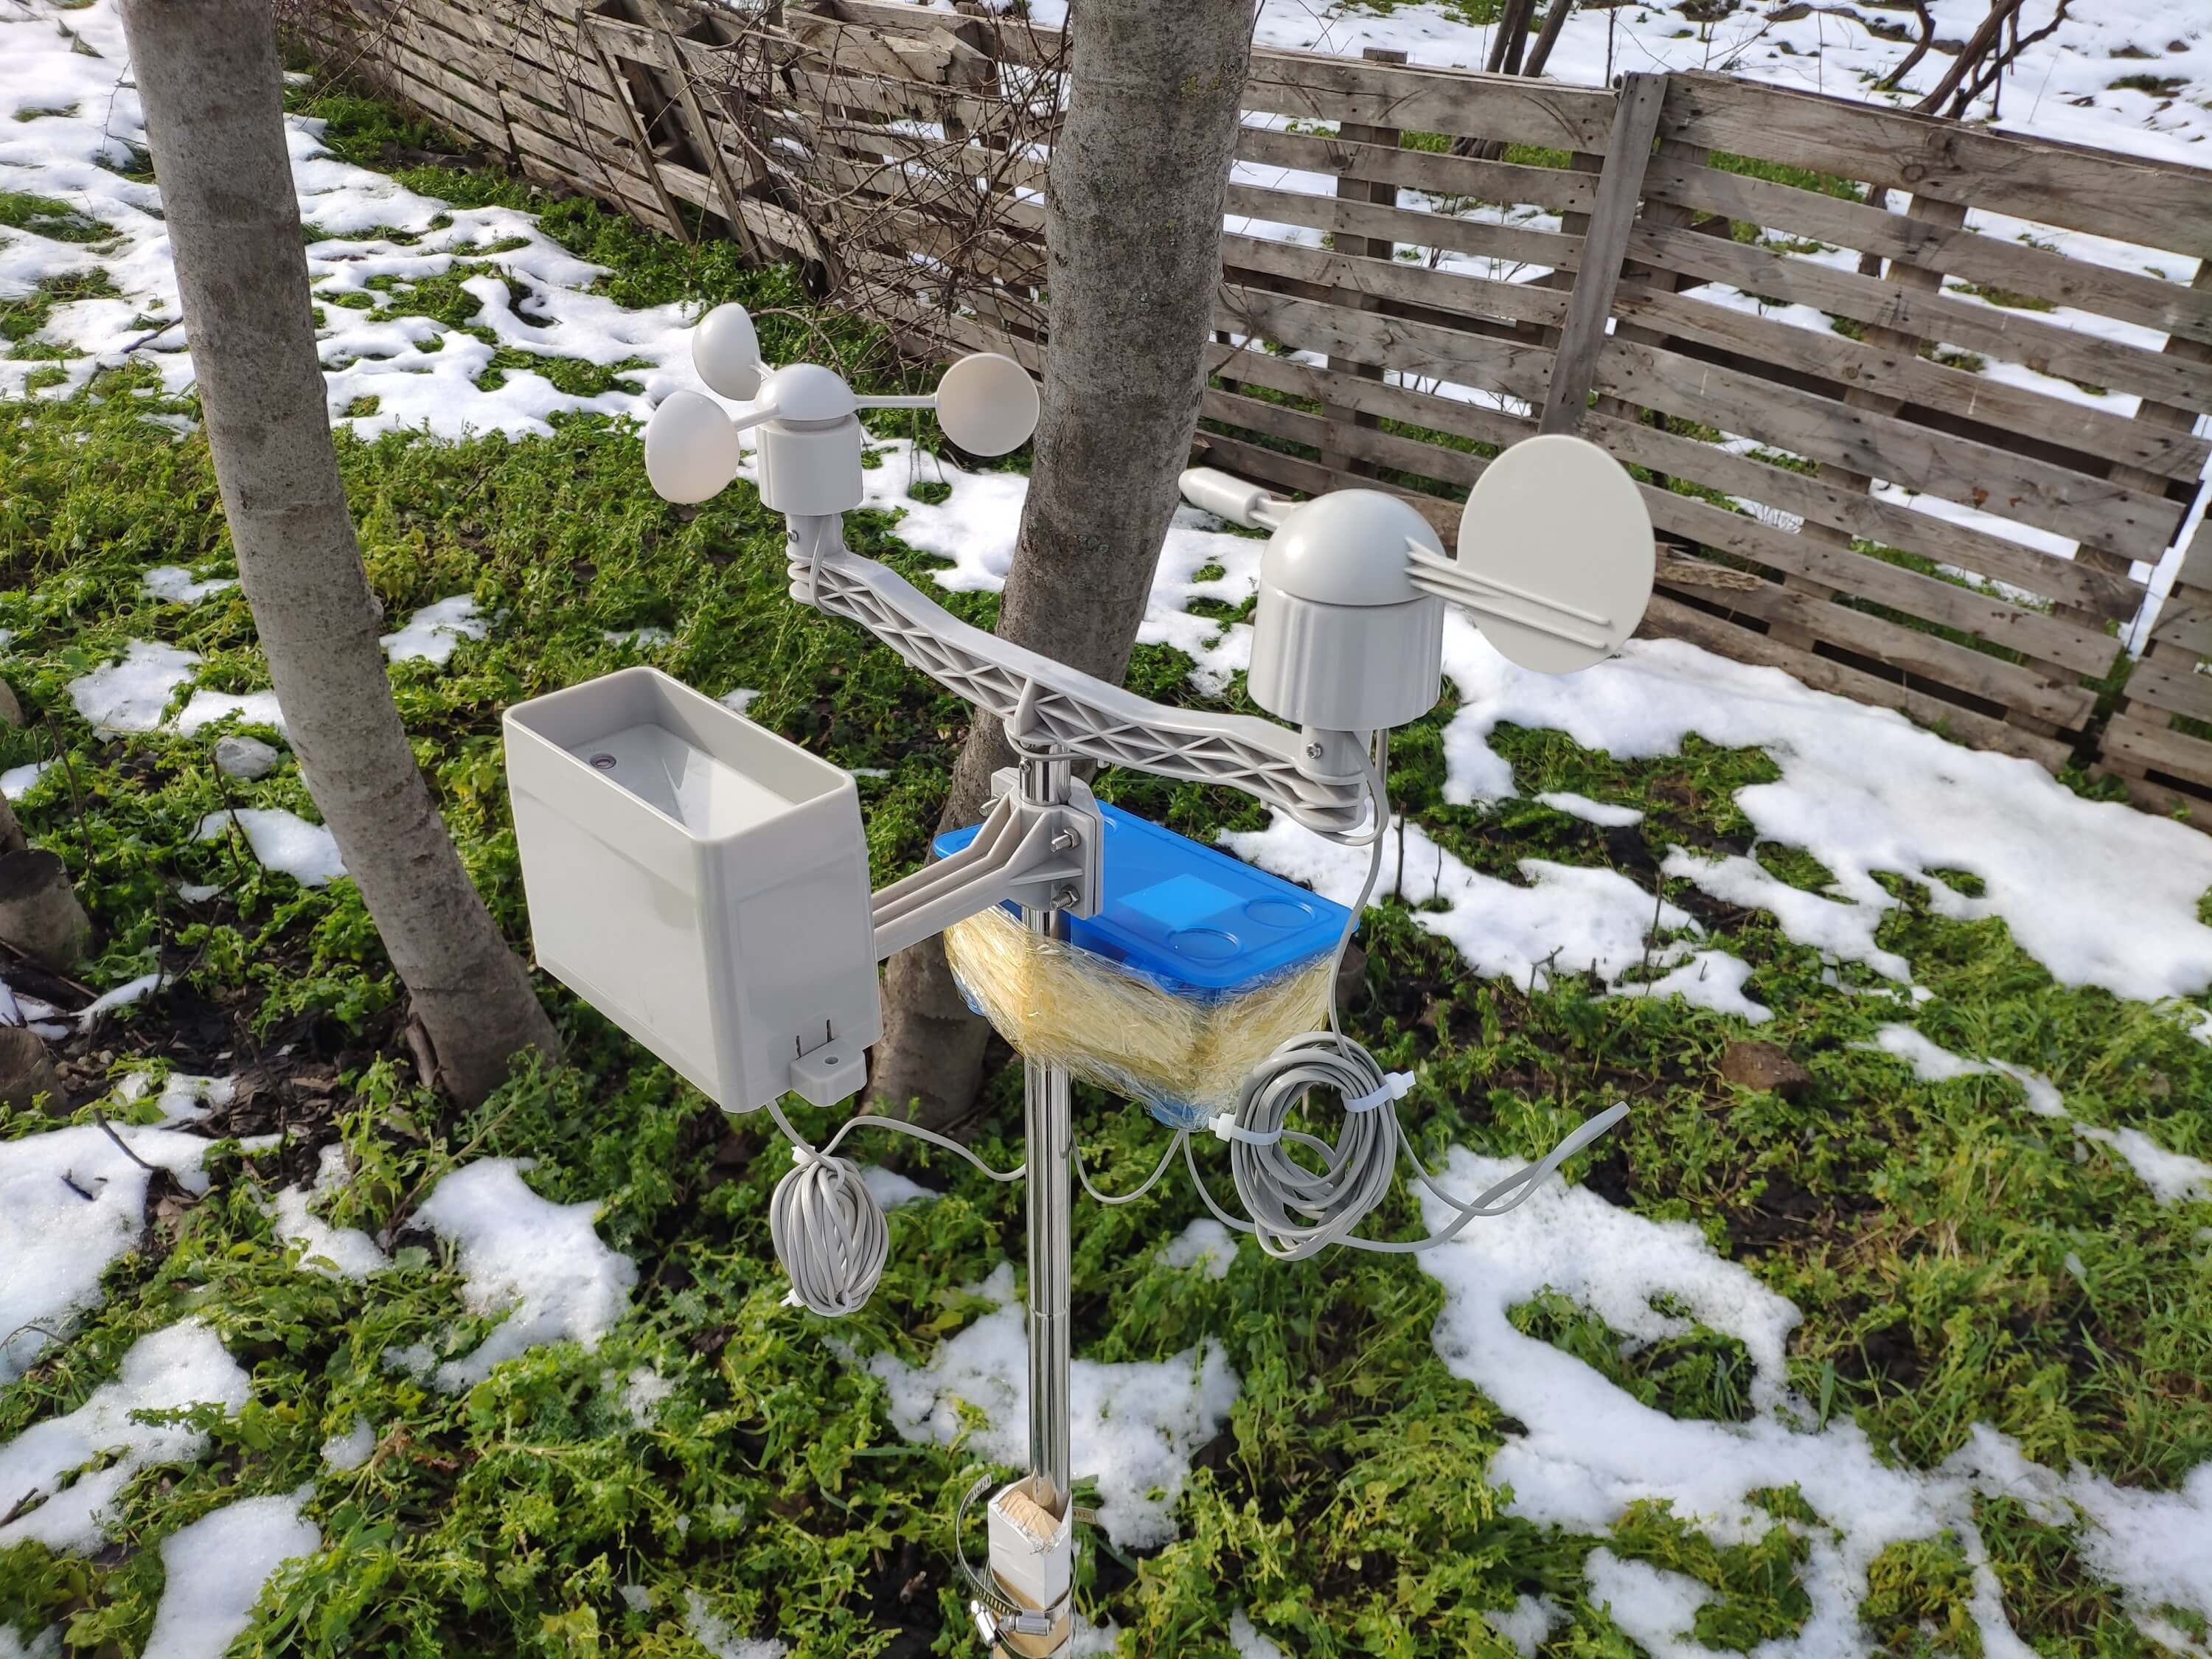
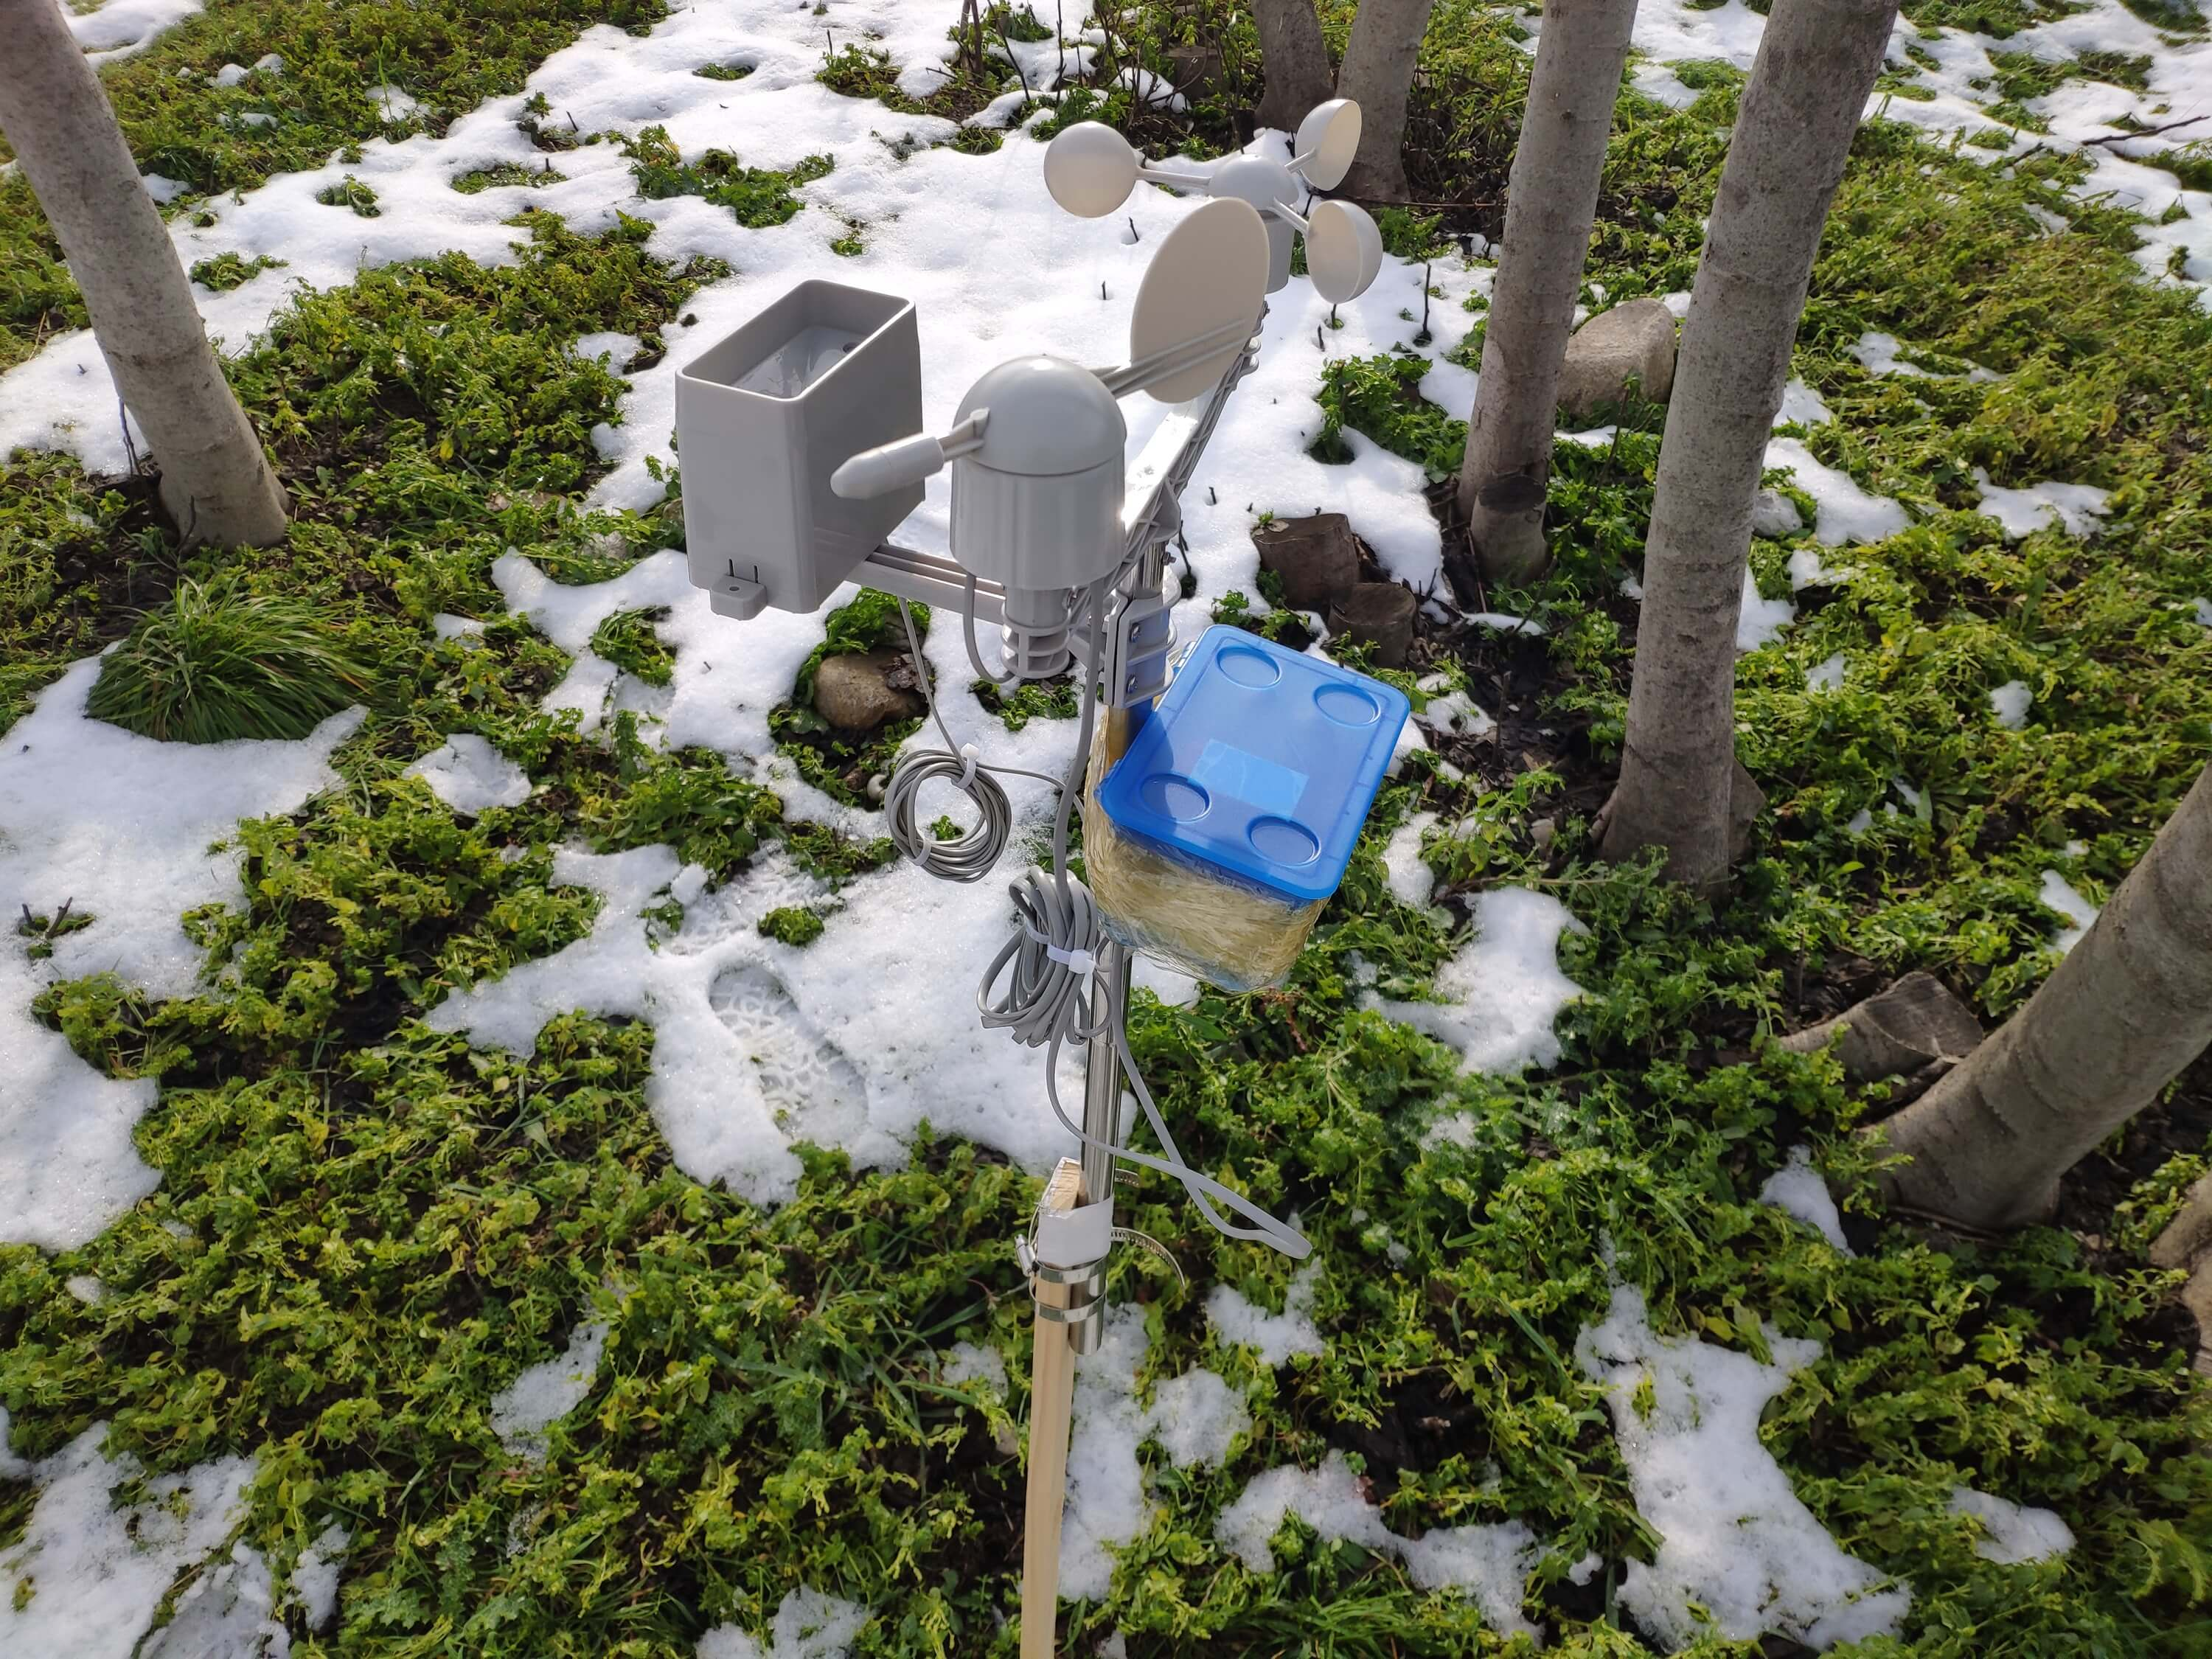
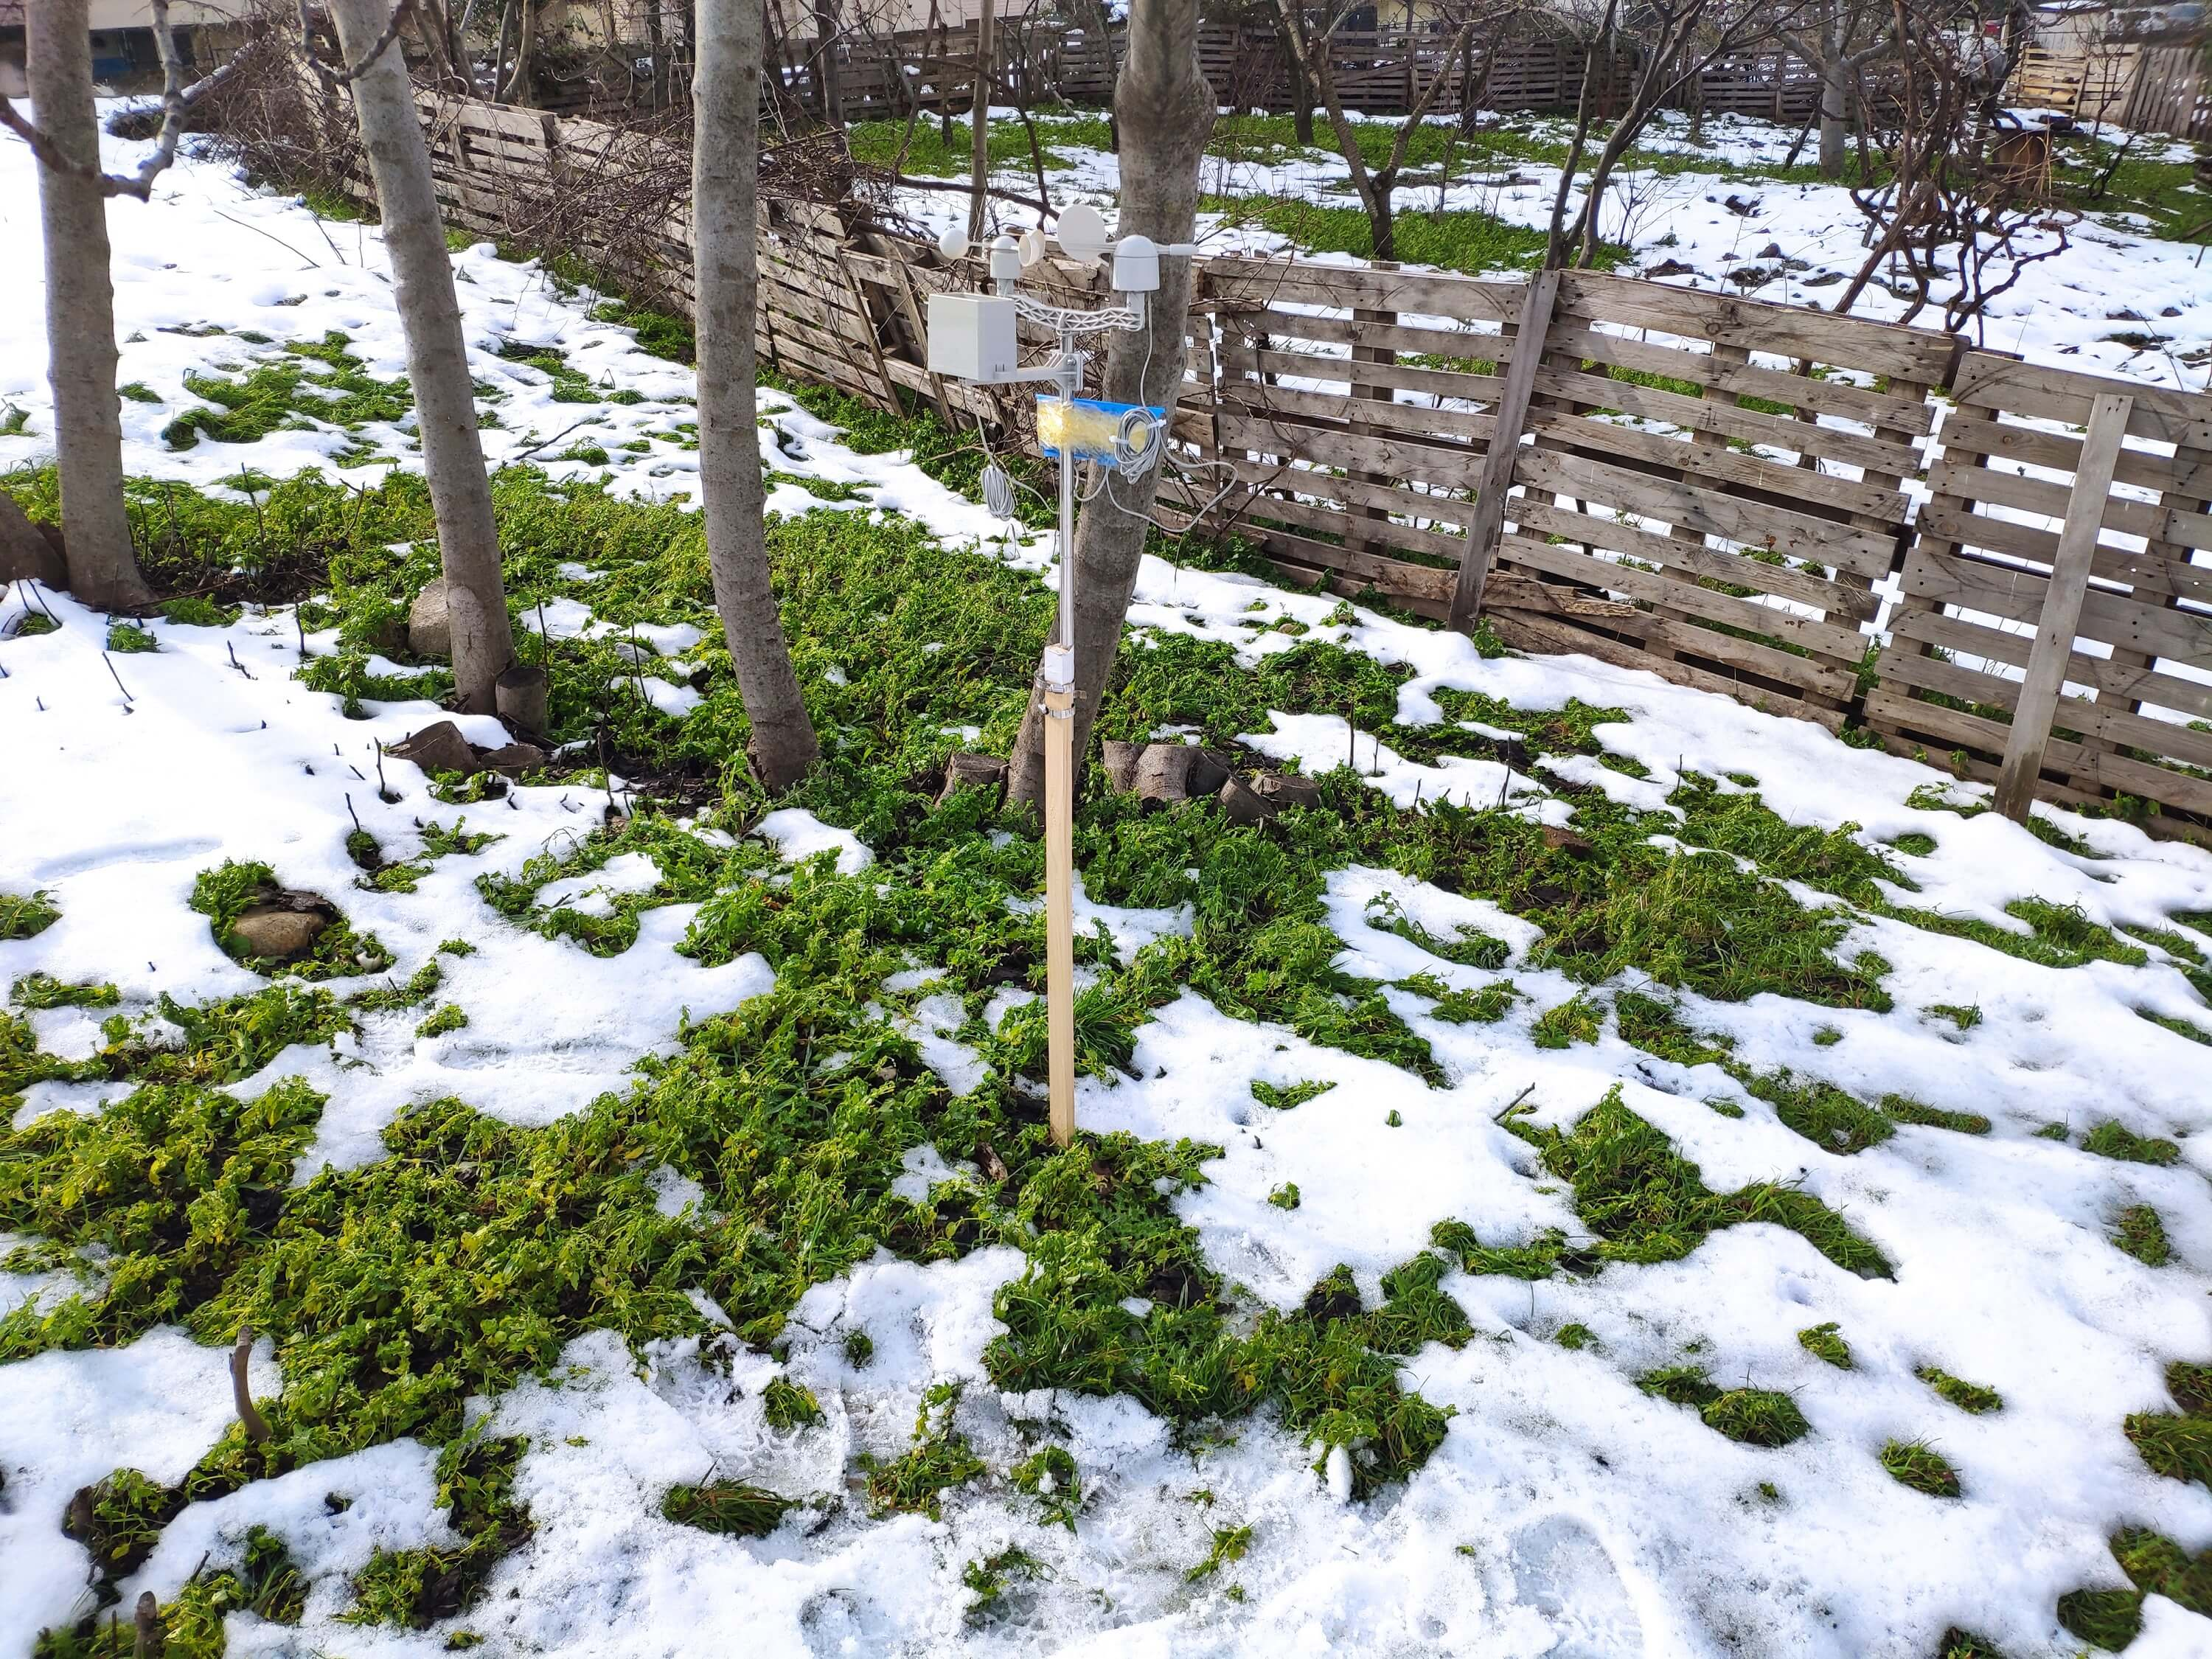
Antes de construir e testar meu modelo de rede neural, eu havia coletado dados meteorológicos em minha varanda e quintal em um raio de três quilômetros por mais de três meses para criar um conjunto de dados meteorológicos locais mostrando informações meteorológicas em minha vizinhança. Para conseguir obter informações sobre o clima mesmo em condições climáticas extremas, usei um Kit de estação meteorológica com anemômetro, cata-vento e balde de chuva da DFRobot com duas placas de desenvolvimento diferentes:
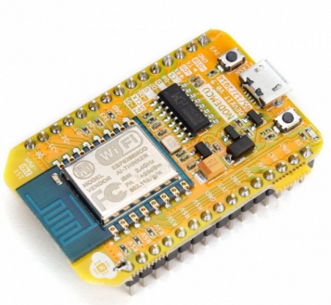
- NodeMCU ESP-12E (habilitado para WiFi)
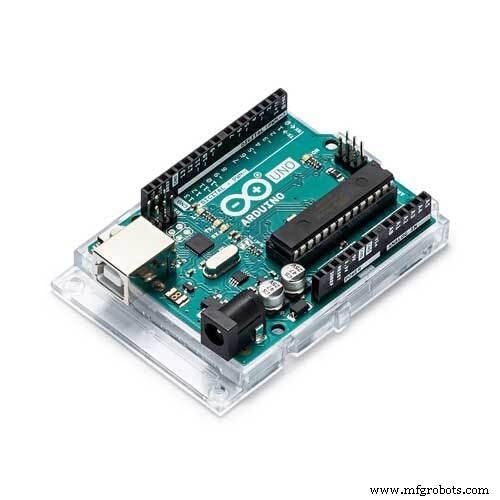
- Arduino Uno + DFRobot SIM808 GPS / GPRS / GSM Shield (GPRS habilitado)
Assim, posso transferir dados meteorológicos via WiFi na minha varanda ou GPRS se a distância entre o meu roteador e a estação meteorológica for muito grande.
Decidi usar o Google Sheets, um programa de planilha baseado em nuvem, para coletar dados meteorológicos gerados pela estação meteorológica porque criar conjuntos de big data e anexar novas informações é simples com a API do Google Sheets. Por isso, desenvolvi uma aplicação web em PHP para obter dados meteorológicos transferidos pelas placas de desenvolvimento e anexá-los a uma planilha no Planilhas Google.
Depois de completar a coleta de dados meteorológicos por mais de três meses a cada cinco minutos, construí um modelo de rede neural artificial (ANN) com TensorFlow para fazer previsões sobre a intensidade da chuva. Teoricamente, atribuí uma classe de intensidade de chuva para cada leitura após escalar e normalizar o conjunto de dados. Em seguida, treinei o modelo de rede neural para classificar essas classes:
- Sem chuva
- Chuva fraca
- Precipitação moderada
- Chuva forte
- Chuva violenta
Portanto, este é o meu projeto em poucas palavras 😃
Nas etapas a seguir, você pode encontrar informações mais detalhadas sobre codificação, coleta de dados meteorológicos locais e construção de um modelo de rede neural artificial (ANN) com TensorFlow.
Um grande obrigado ao DFRobot por patrocinar este projeto.
Produtos patrocinados pela DFRobot:
⭐ Kit de estação meteorológica com anemômetro / cata-vento / balde de chuva | Inspecionar
⭐ Escudo SIM808 GPS / GPRS / GSM para Arduino | Inspecionar
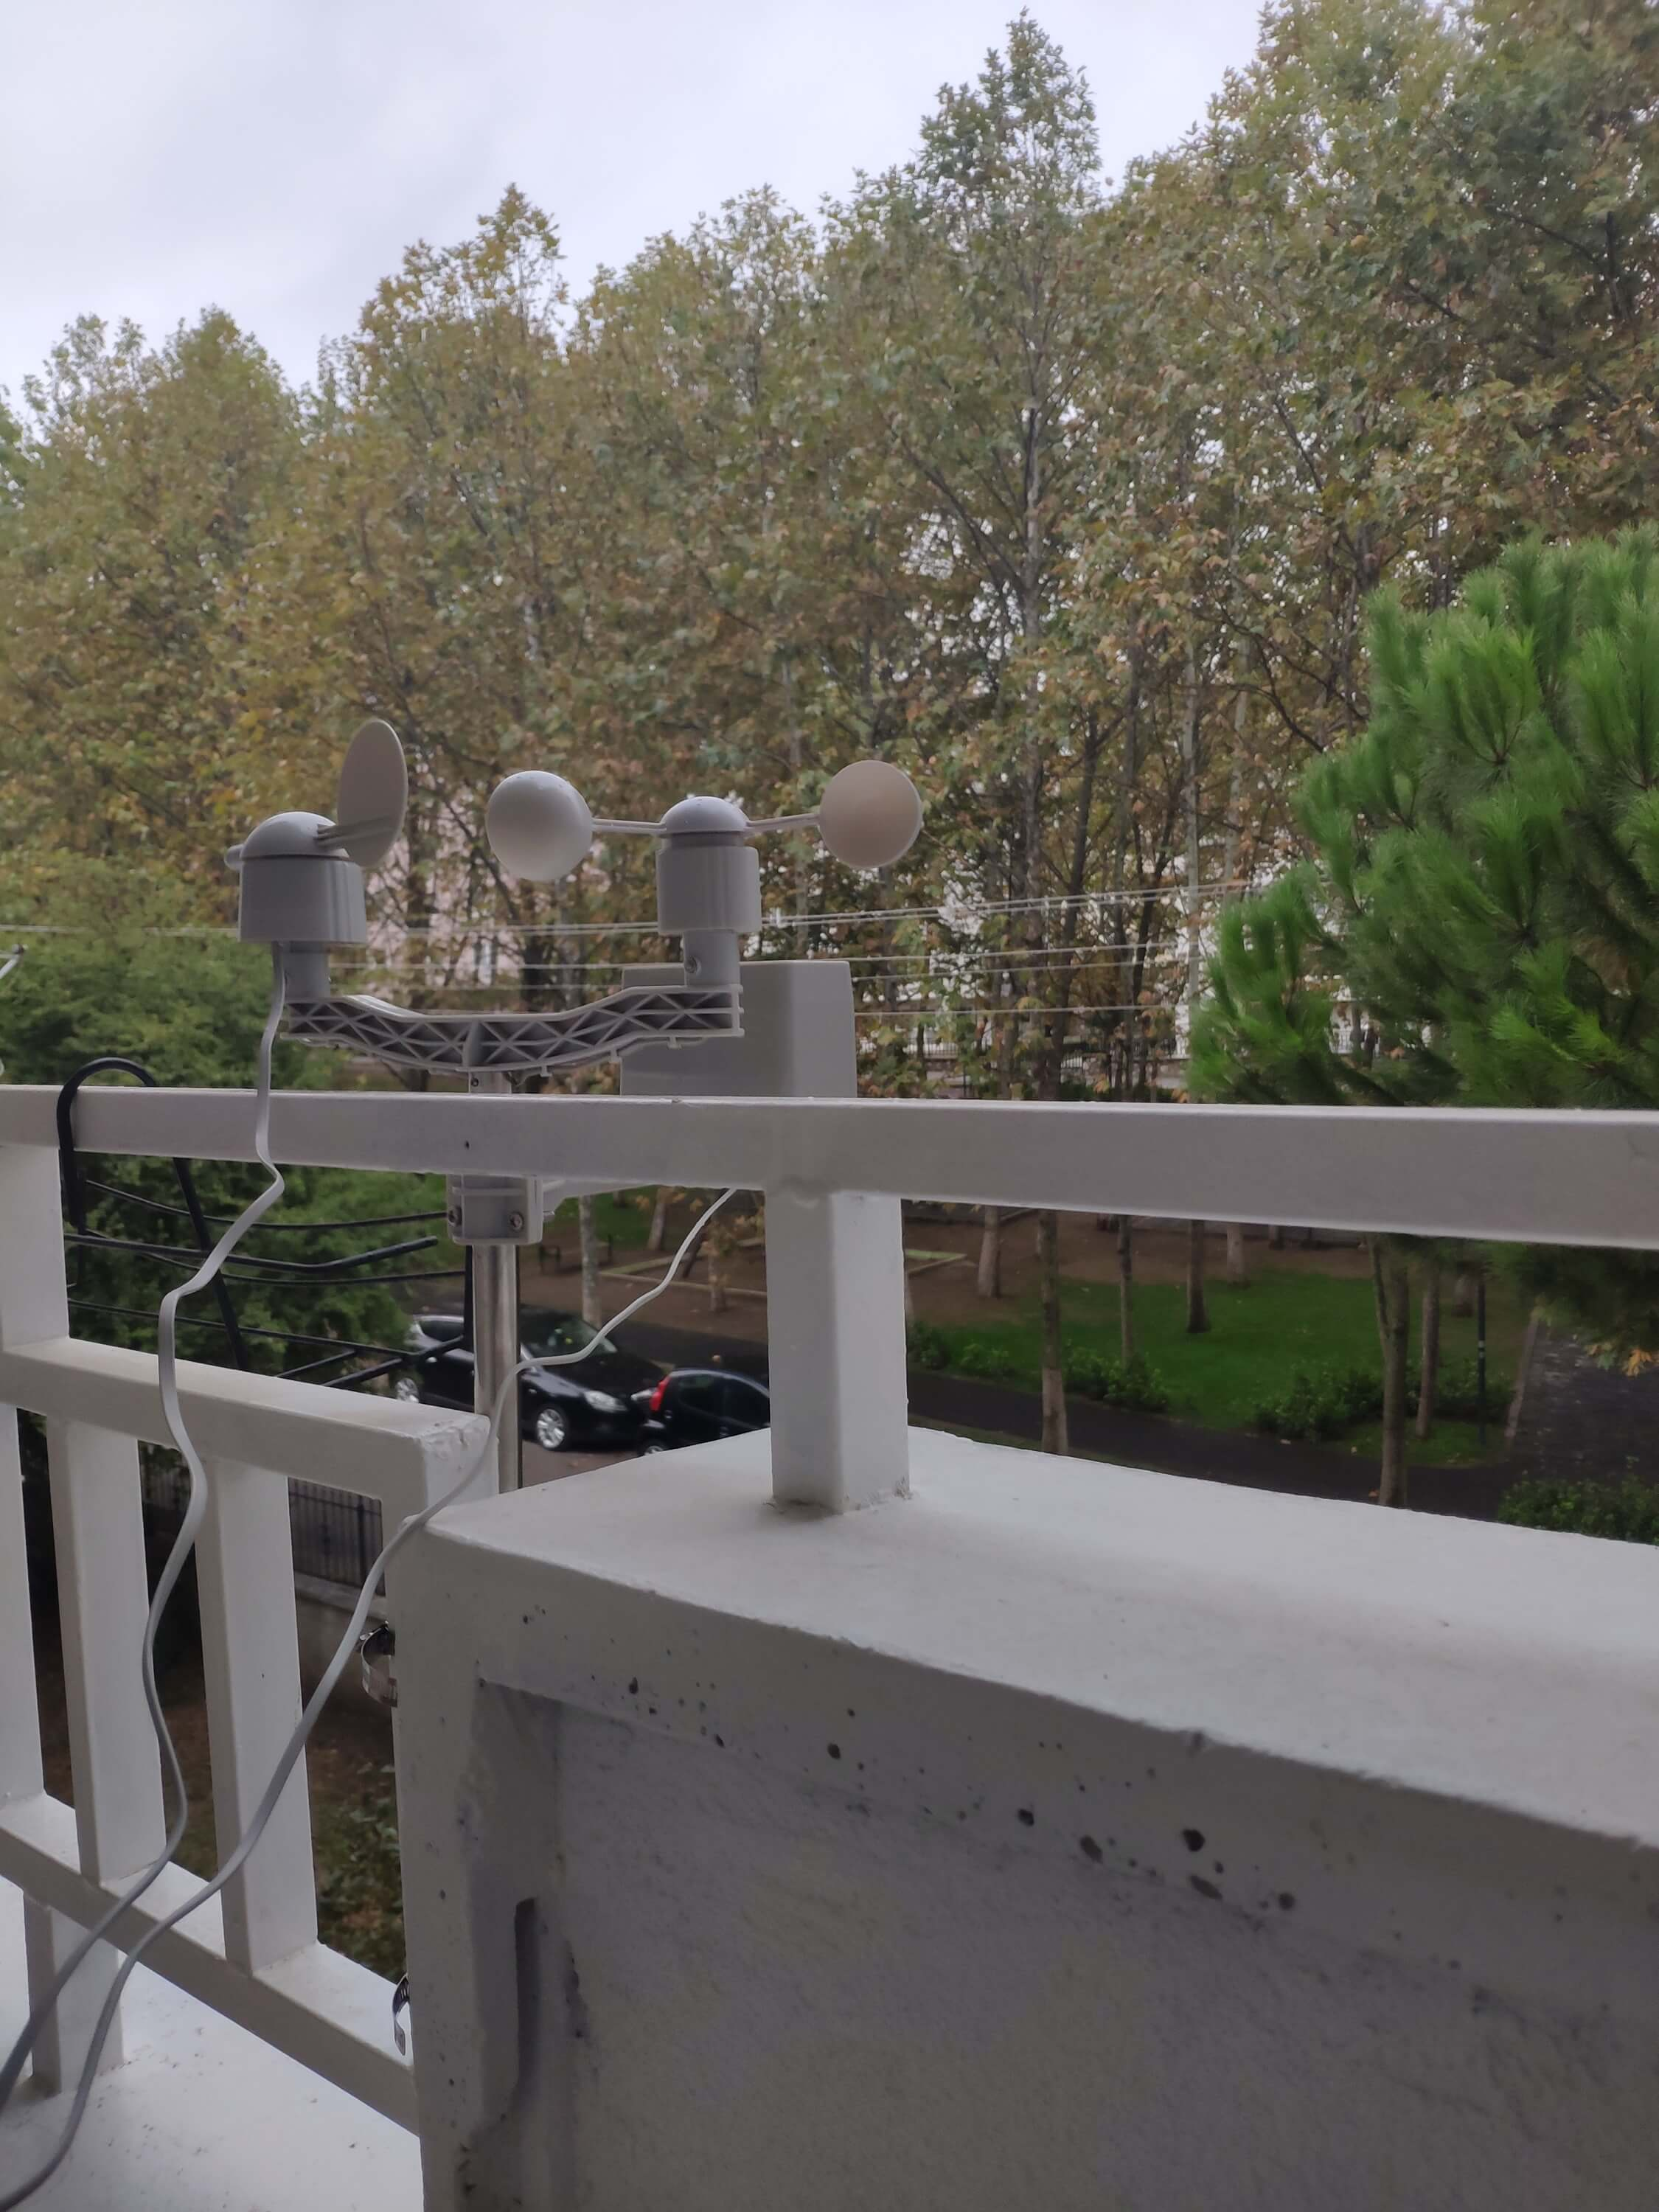
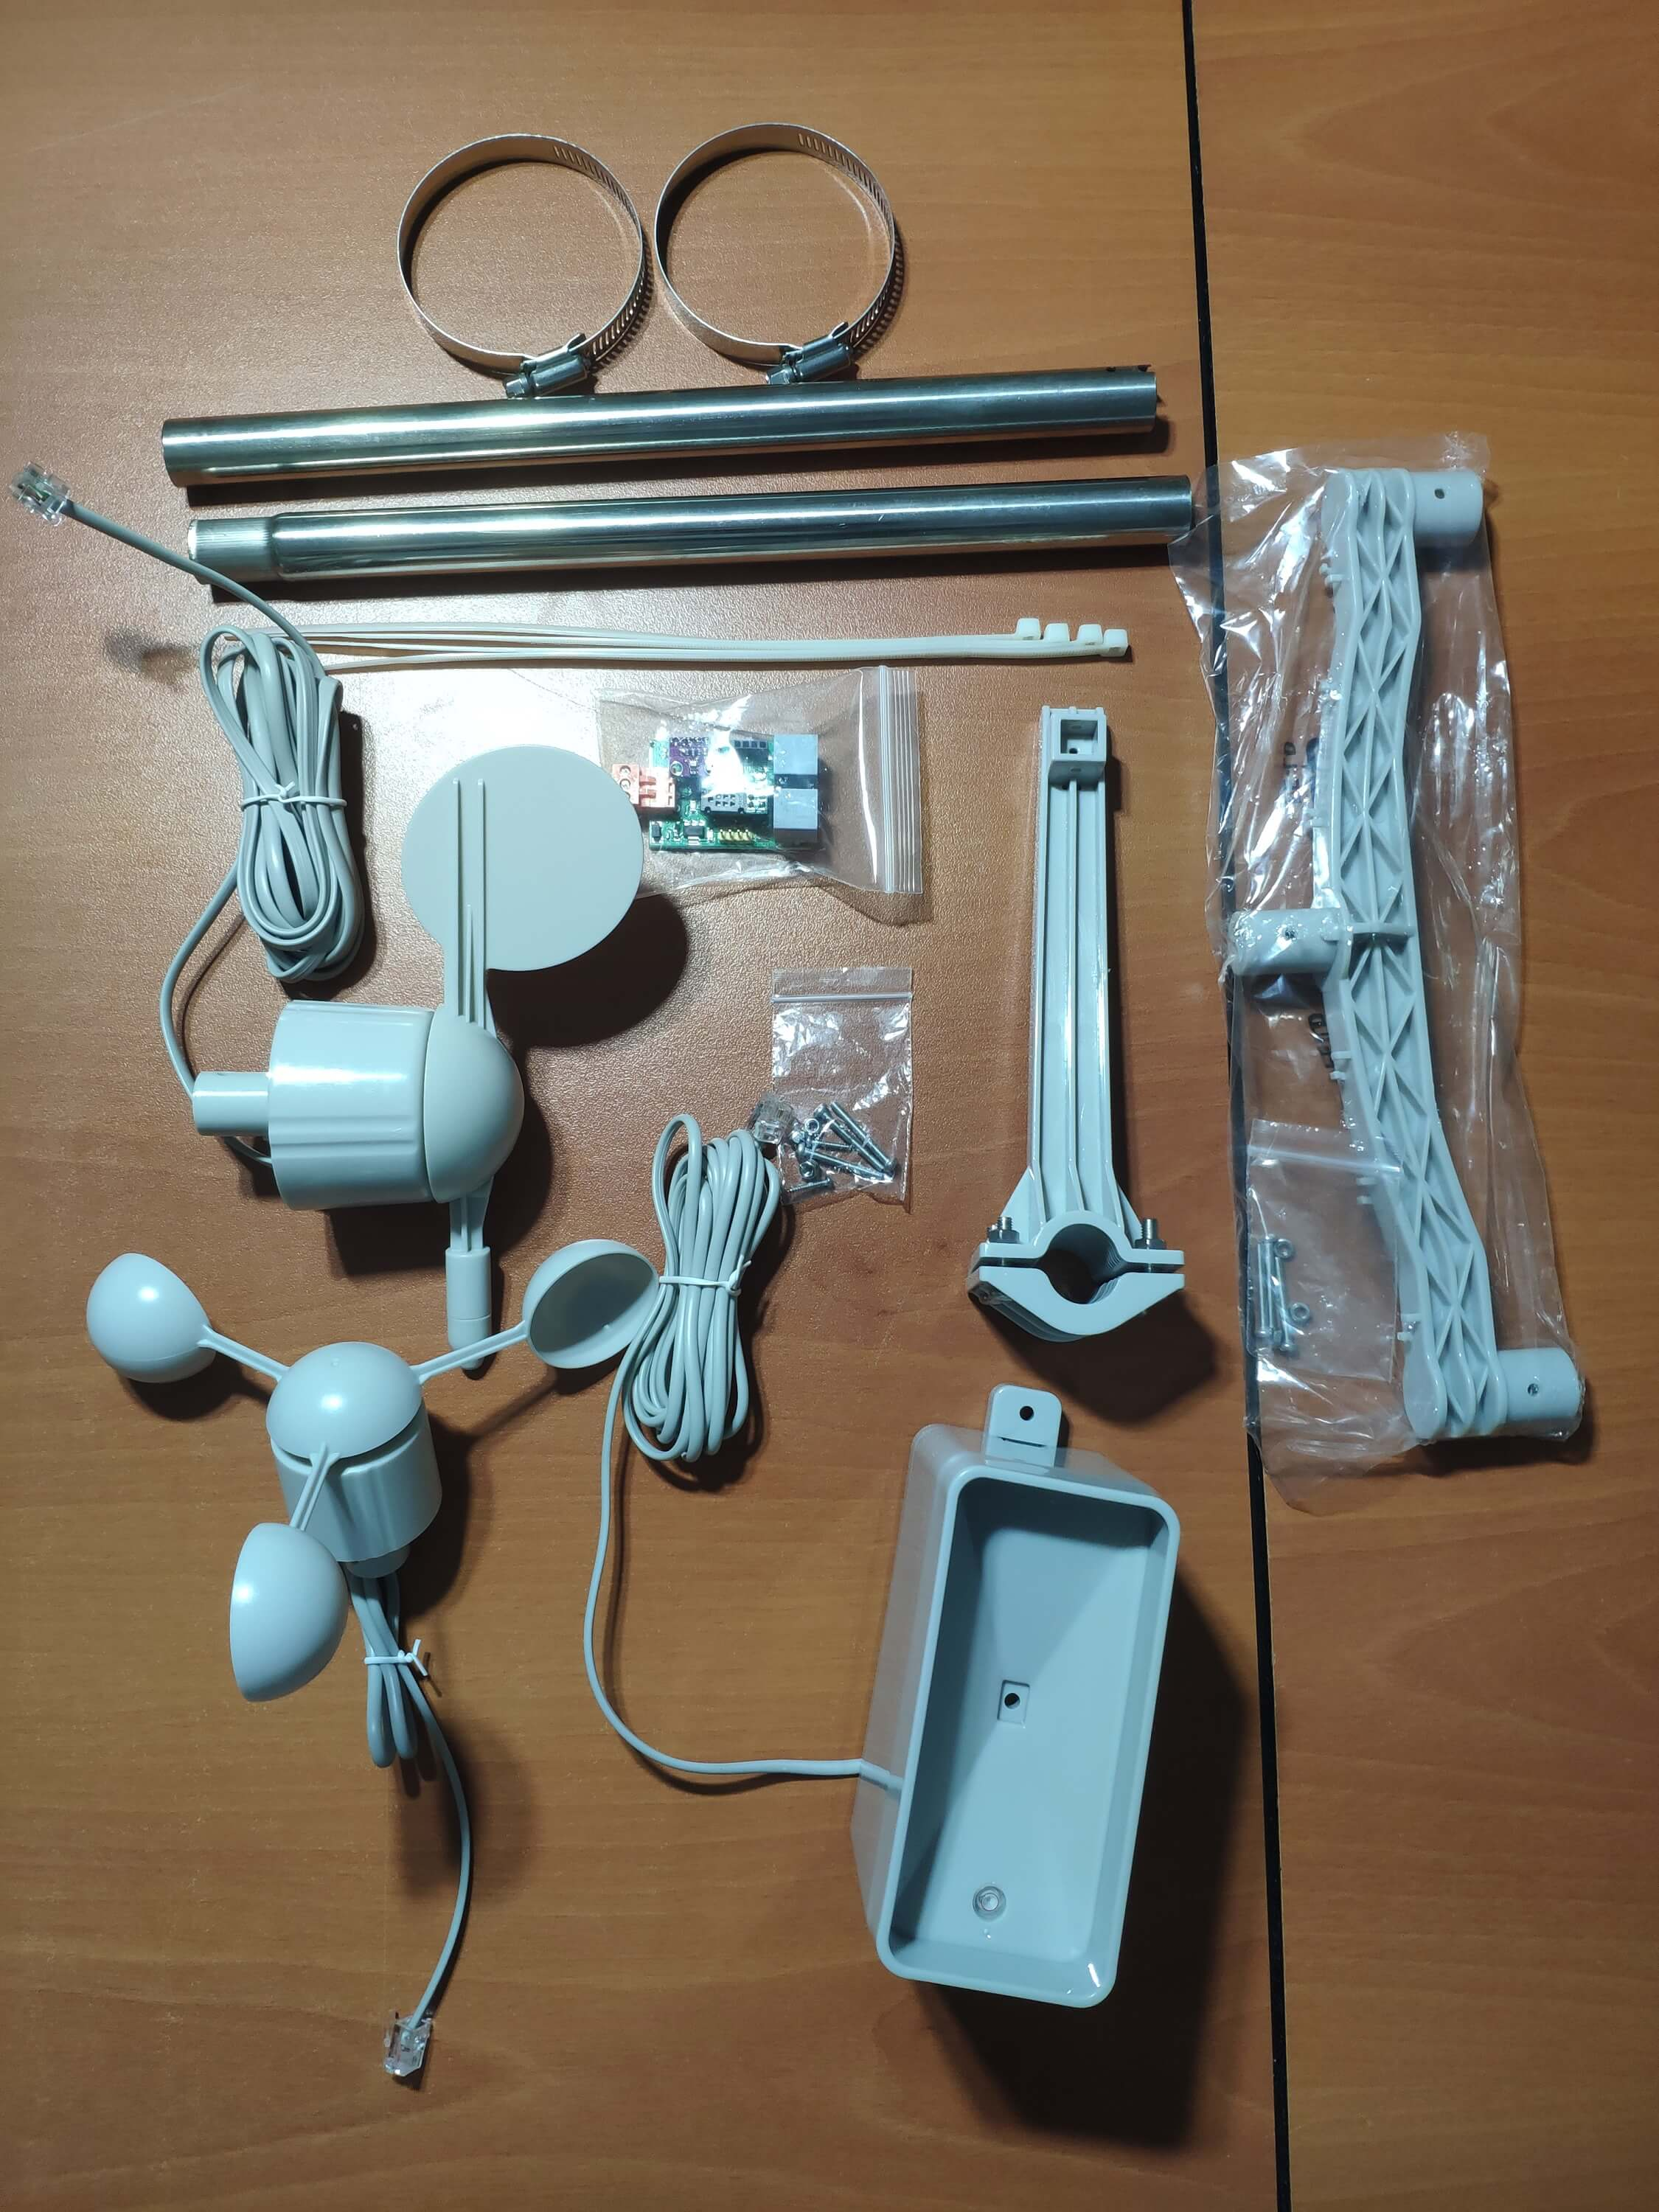
Etapa 1:montagem do kit da estação meteorológica com anemômetro, cata-vento e balde de chuva
Este kit de estação meteorológica inclui um anemômetro, cipó, balde de chuva e uma placa de sensor para enviar dados meteorológicos por meio do protocolo de comunicação serial. Portanto, é fácil de usar com placas de desenvolvimento para coletar dados meteorológicos locais.
Ele produz 37 bytes por segundo, incluindo o CR / LF final .
c000s000g000t086r000p000h53b10020 Analisador de dados:
- c000 : Direção do ar, grau
- s000 : Velocidade do ar (média), 0,1 milhas por hora
- g000 : Velocidade do ar (máx.), 0,1 milhas por hora
- t086 : Temperatura, Fahrenheit
- r000 : Chuva (1 hora), 0,01 polegadas
- p000 : Chuva (24 horas), 0,01 polegadas
- h53 : Umidade,% (00 % =100)
- b10020 : Atmosfera, 0,1 hPa
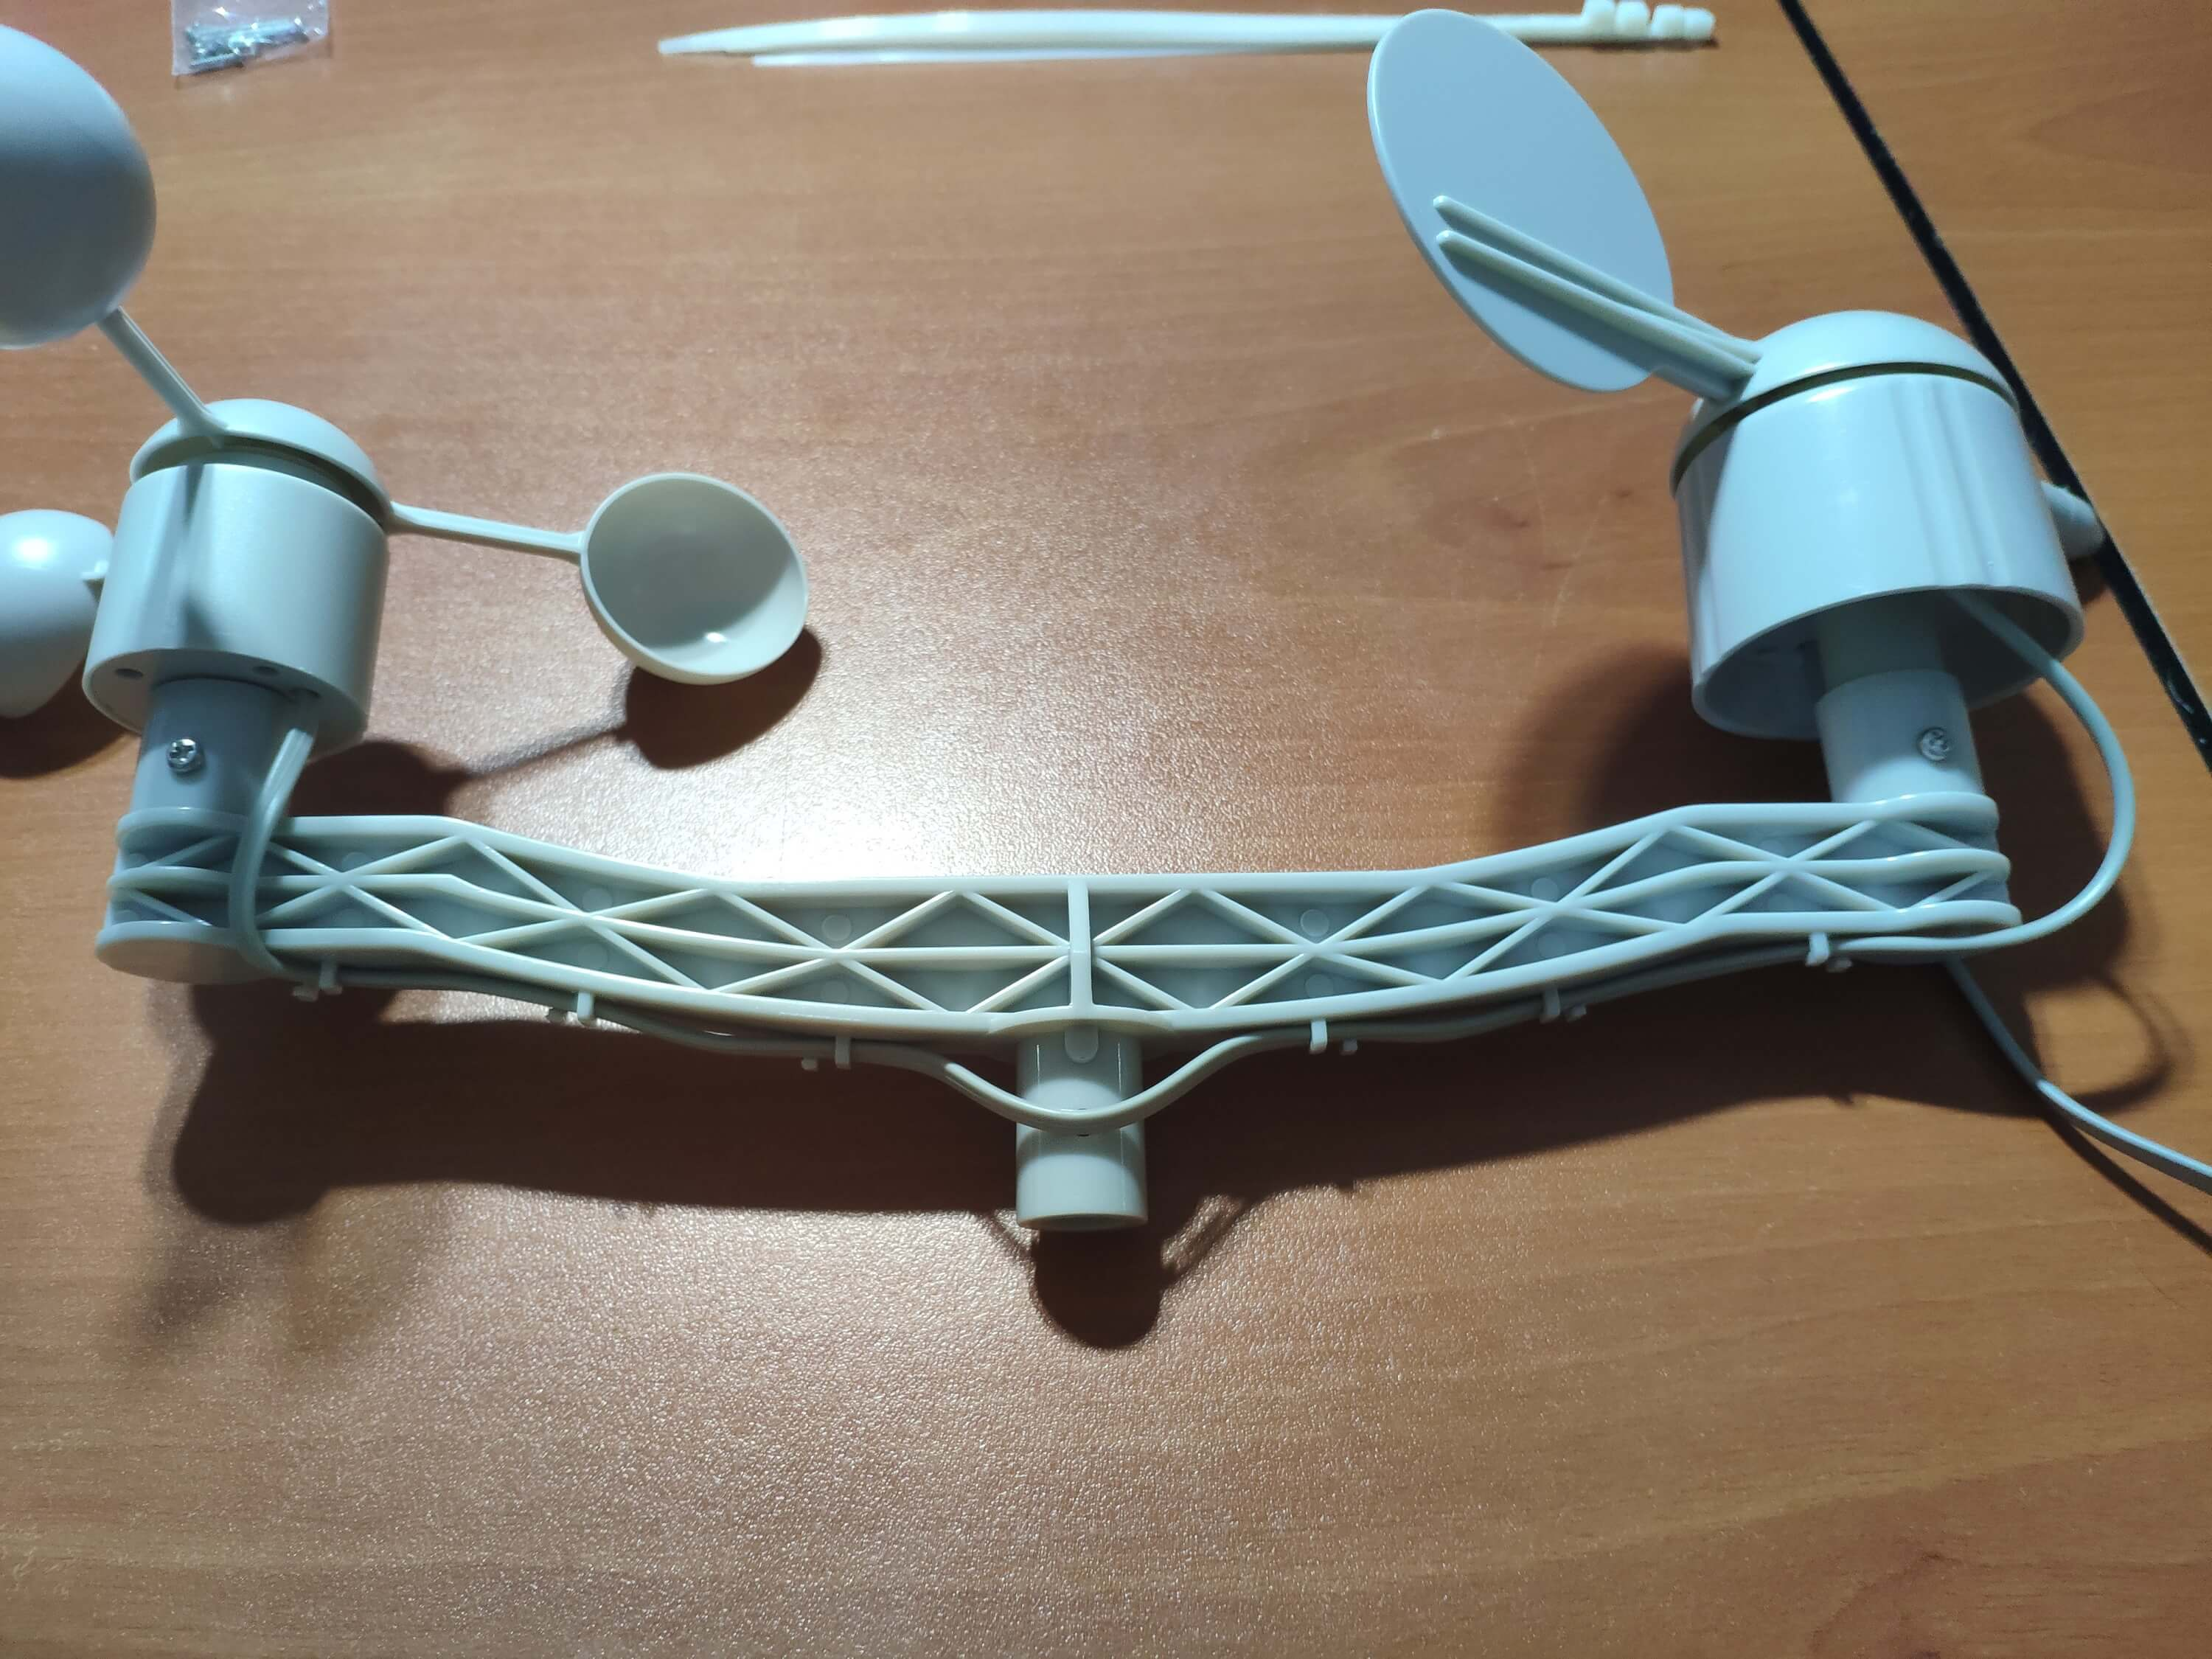
⭐ Em primeiro lugar, prenda o anemômetro e o cata-vento na ponte usando parafusos e porcas.
⭐ Conecte o cata-vento ao anemômetro usando o cabo telefônico RJ11 e aperte-o sob a ponte.
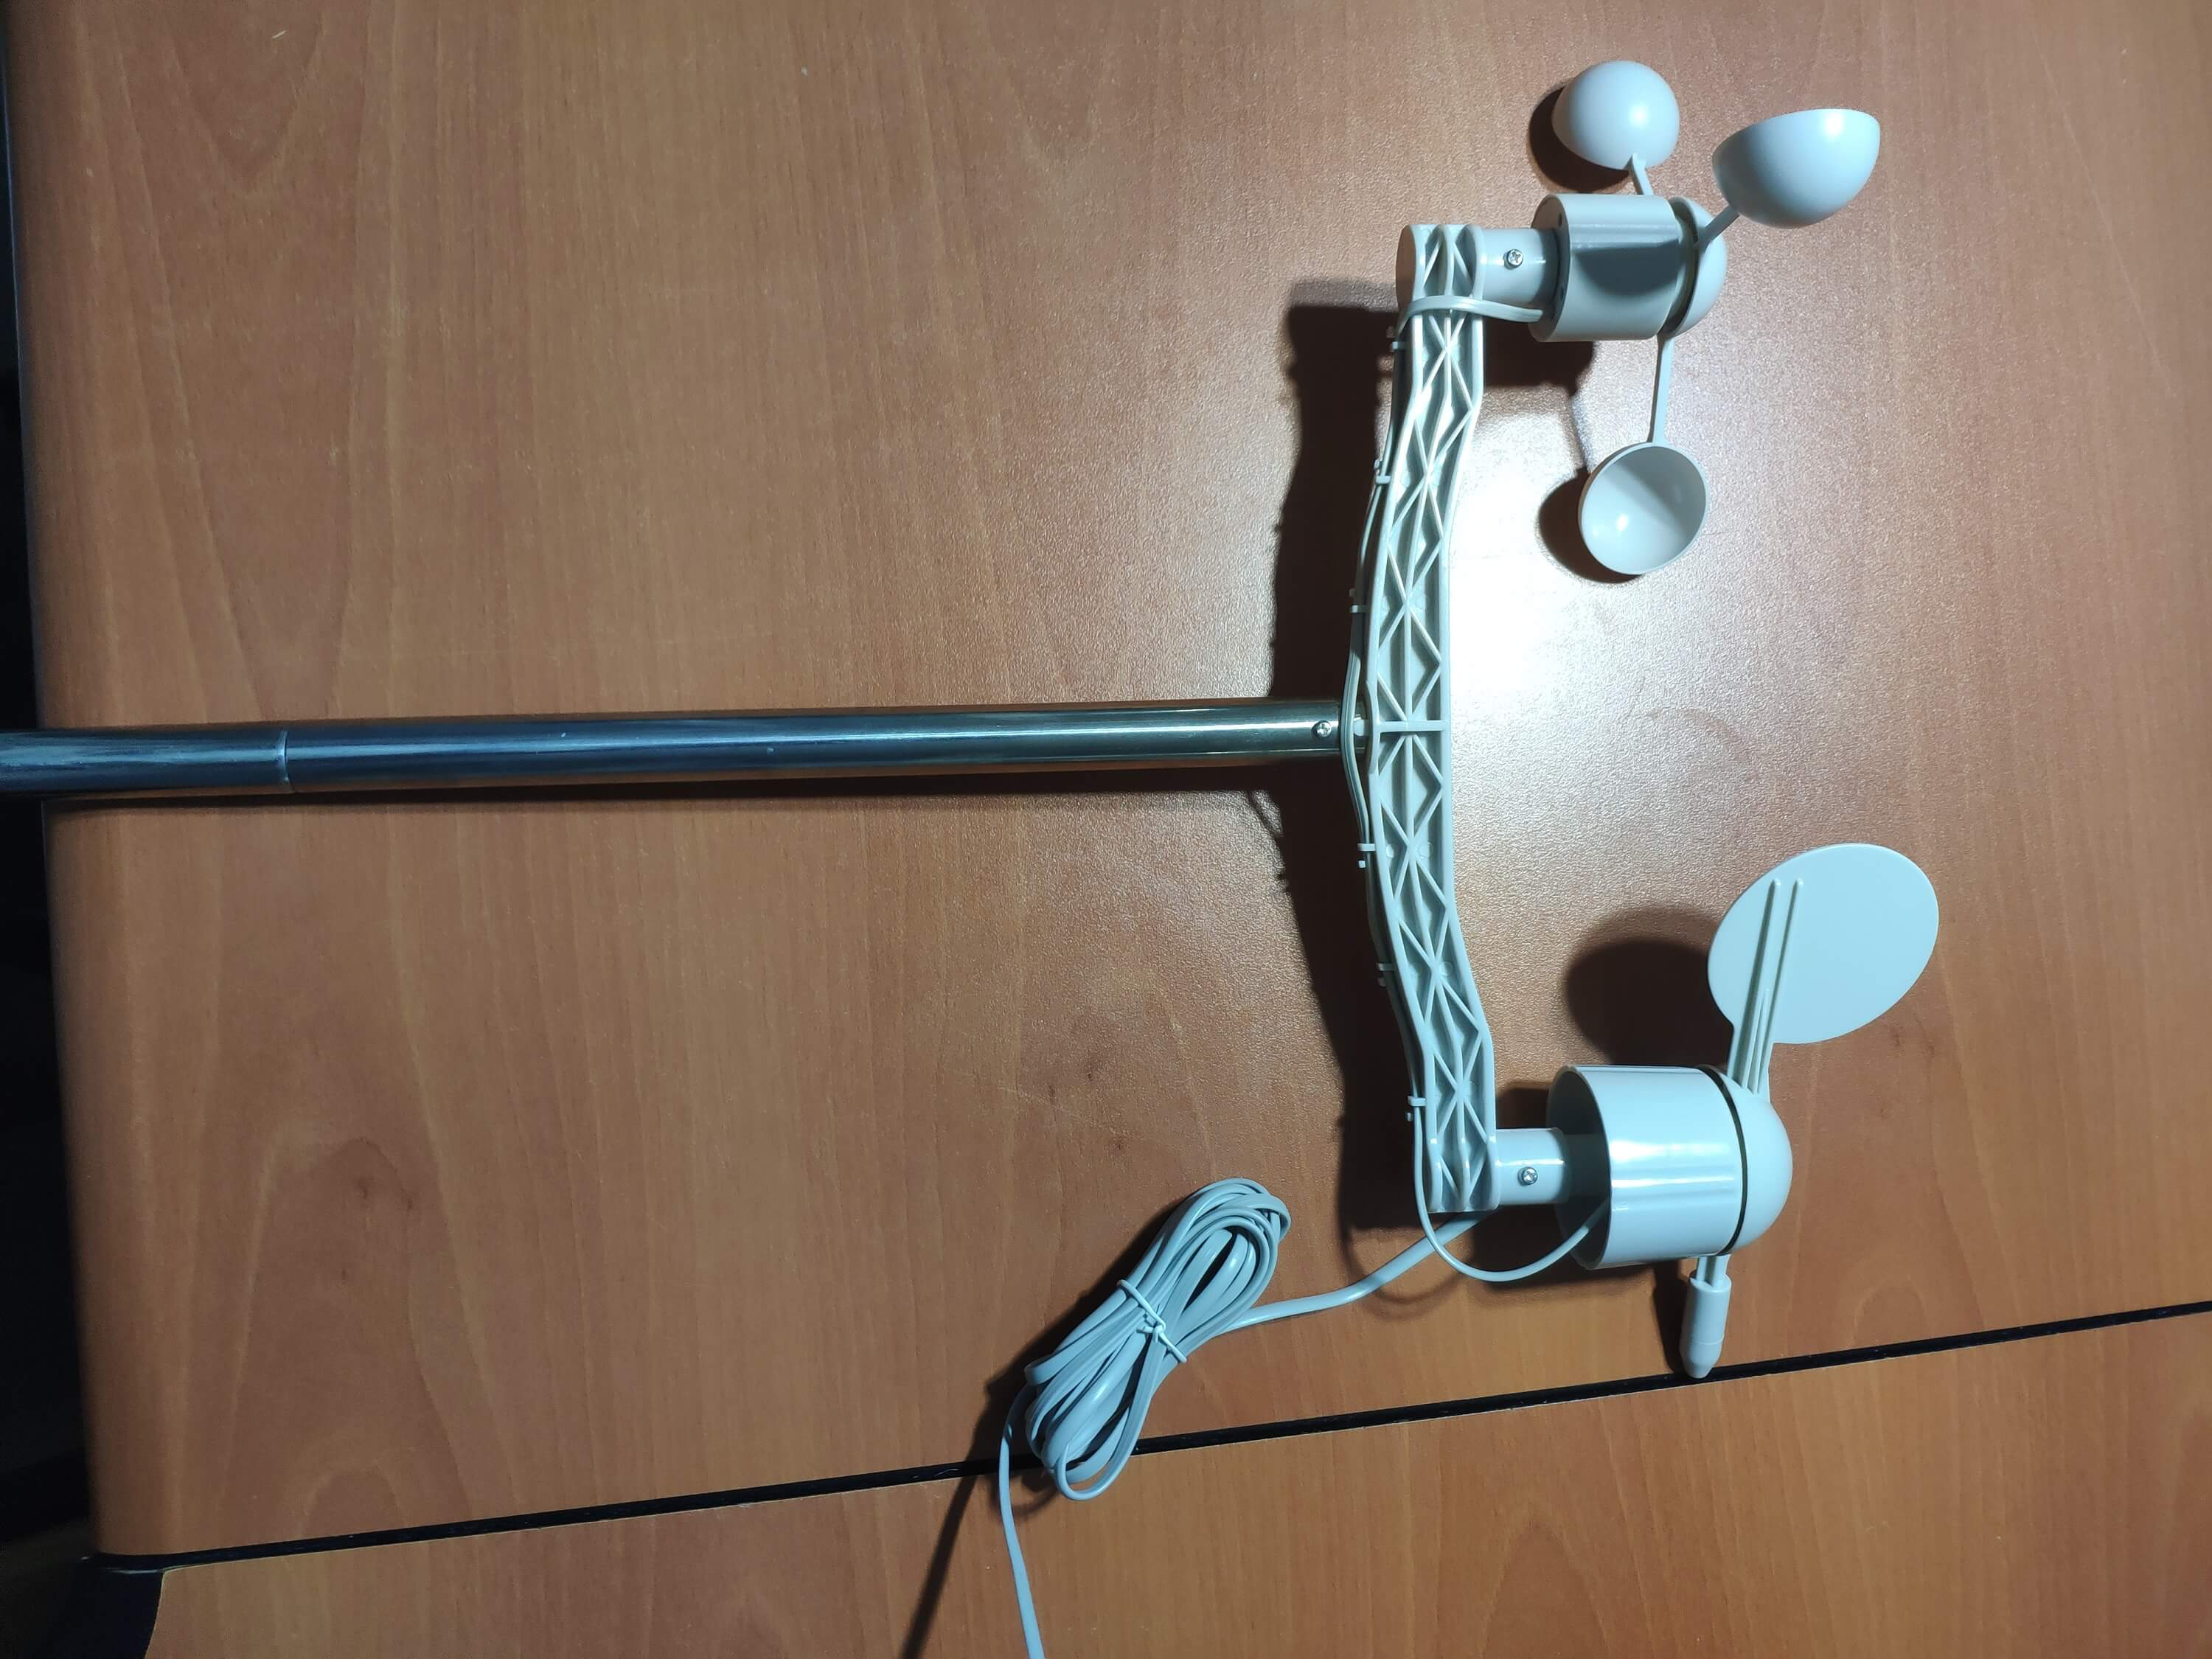
⭐ Em seguida, monte o bastão de aço inoxidável na ponte com parafusos.
⭐ Instale a junta do balde de chuva sob o balde de chuva com parafusos.
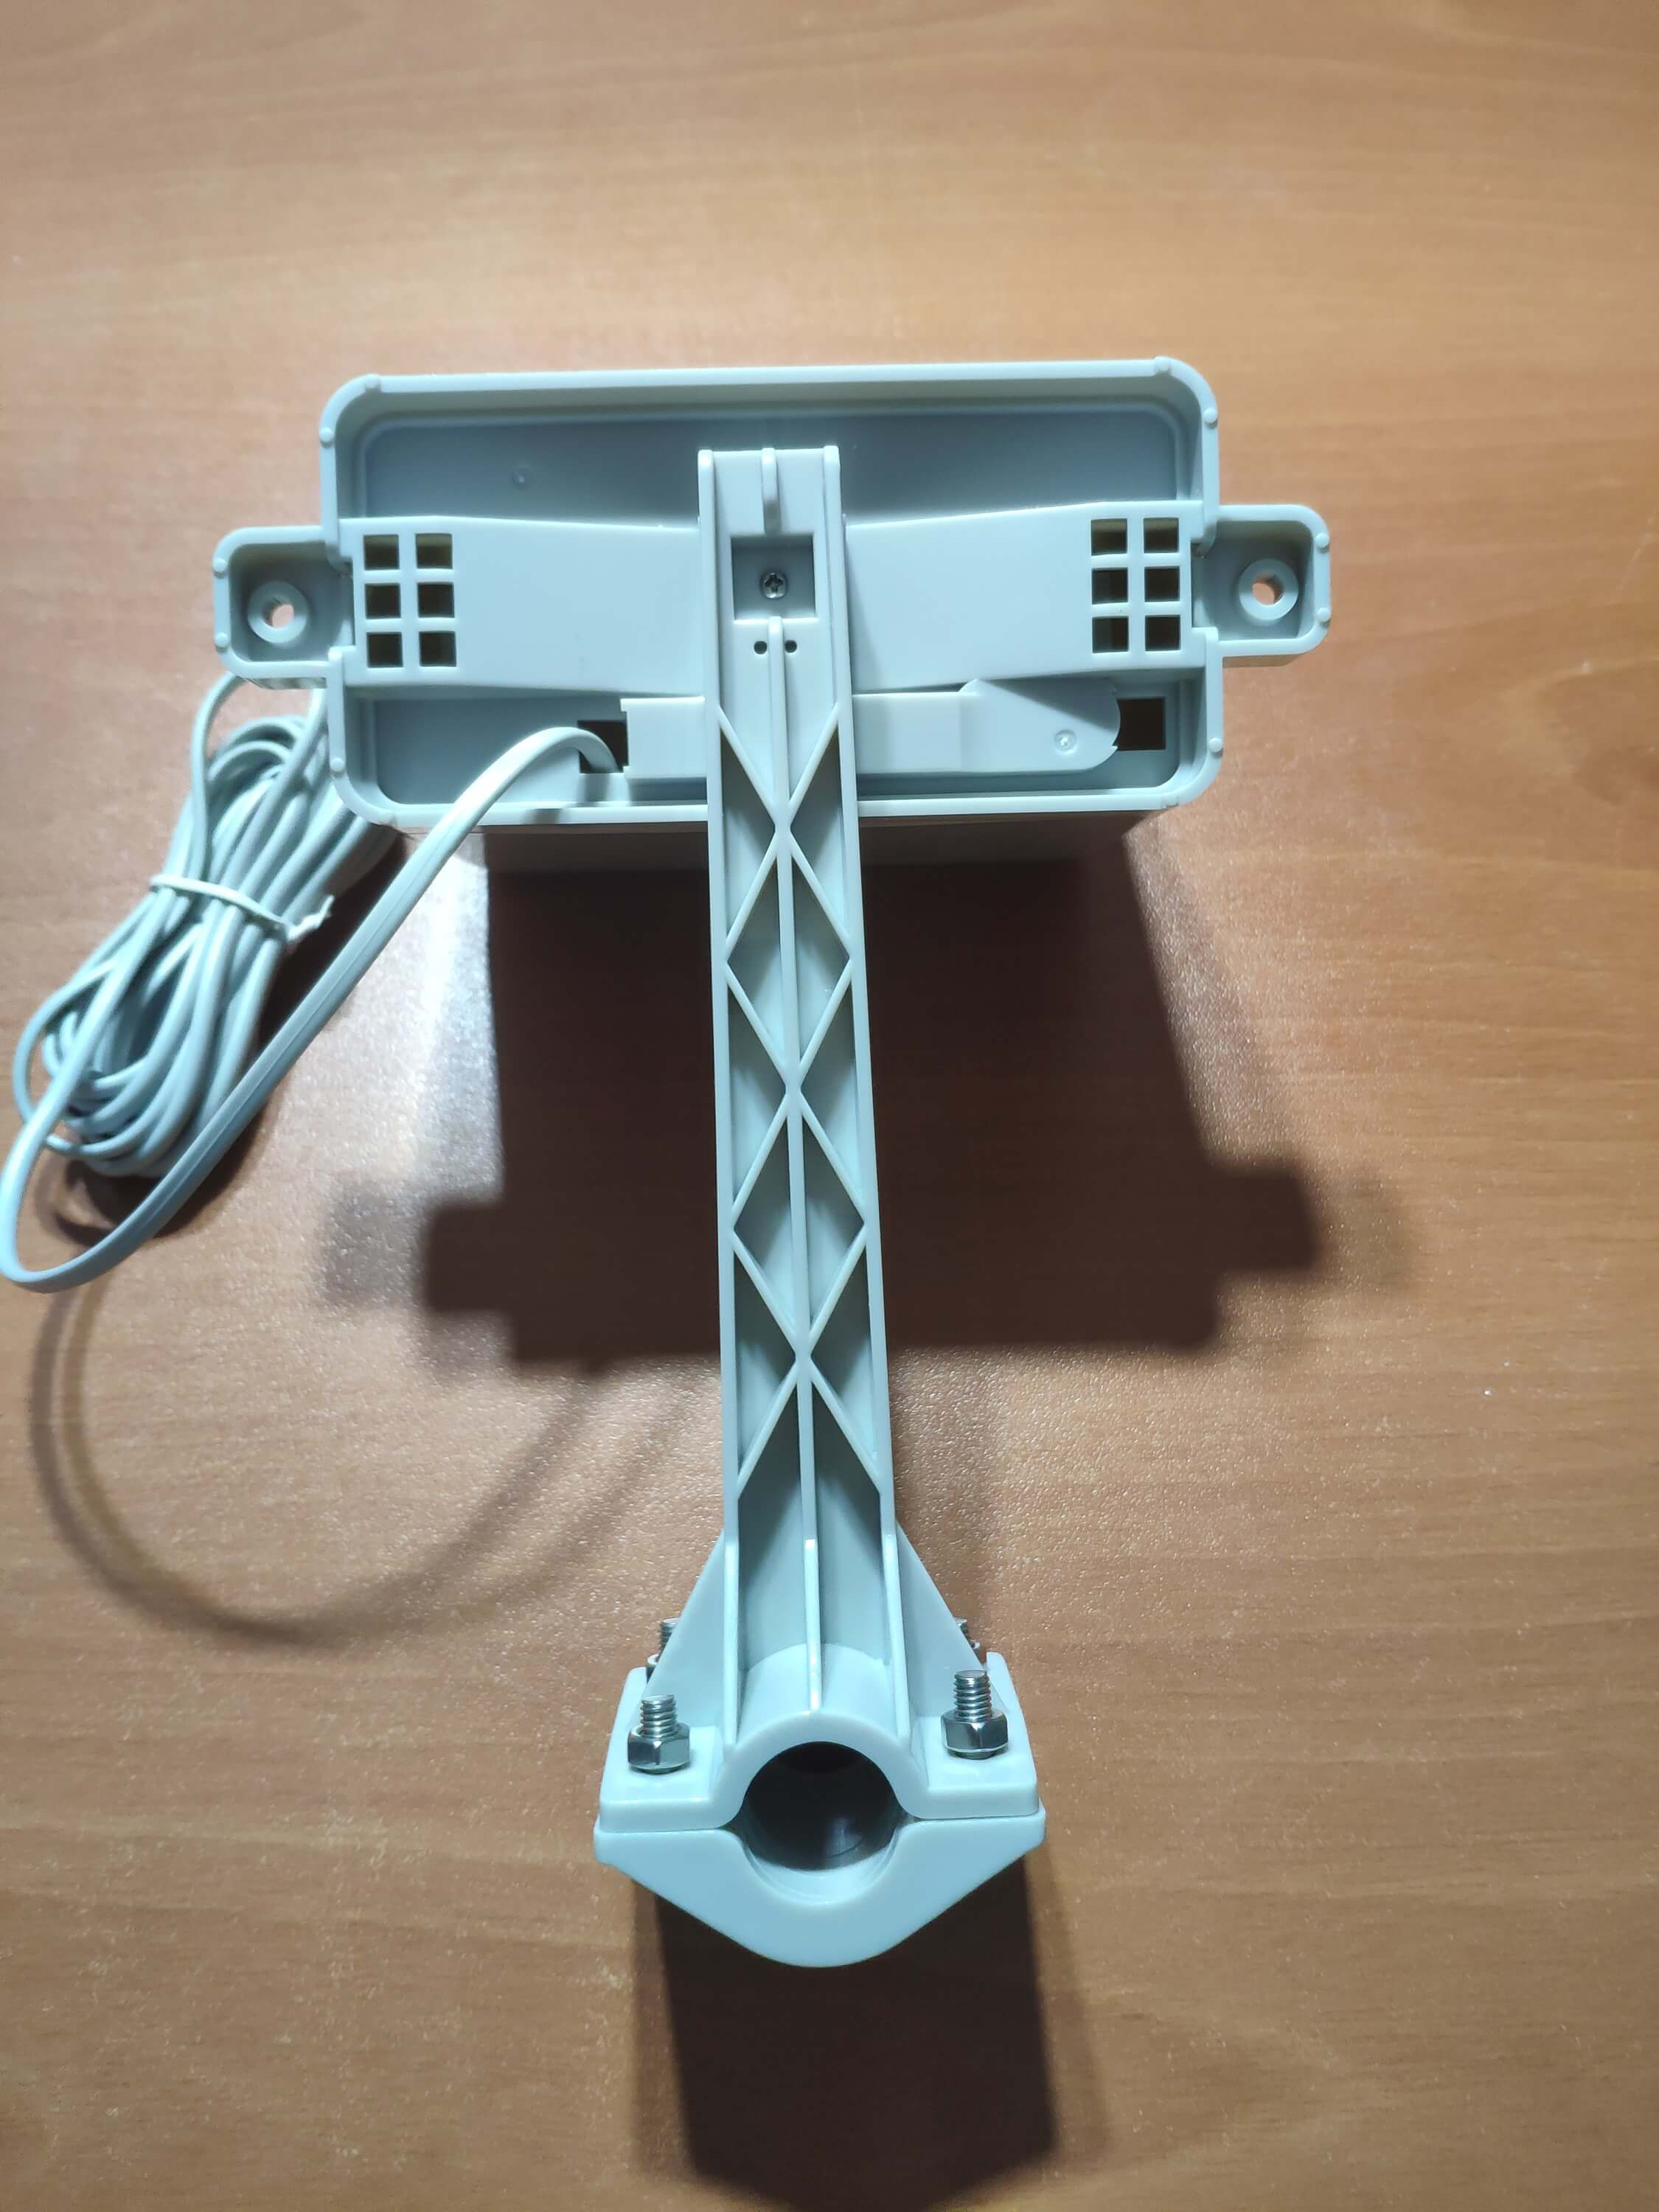
⭐ Por último, coloque o balde de chuva no bastão de aço inoxidável usando parafusos e porcas.
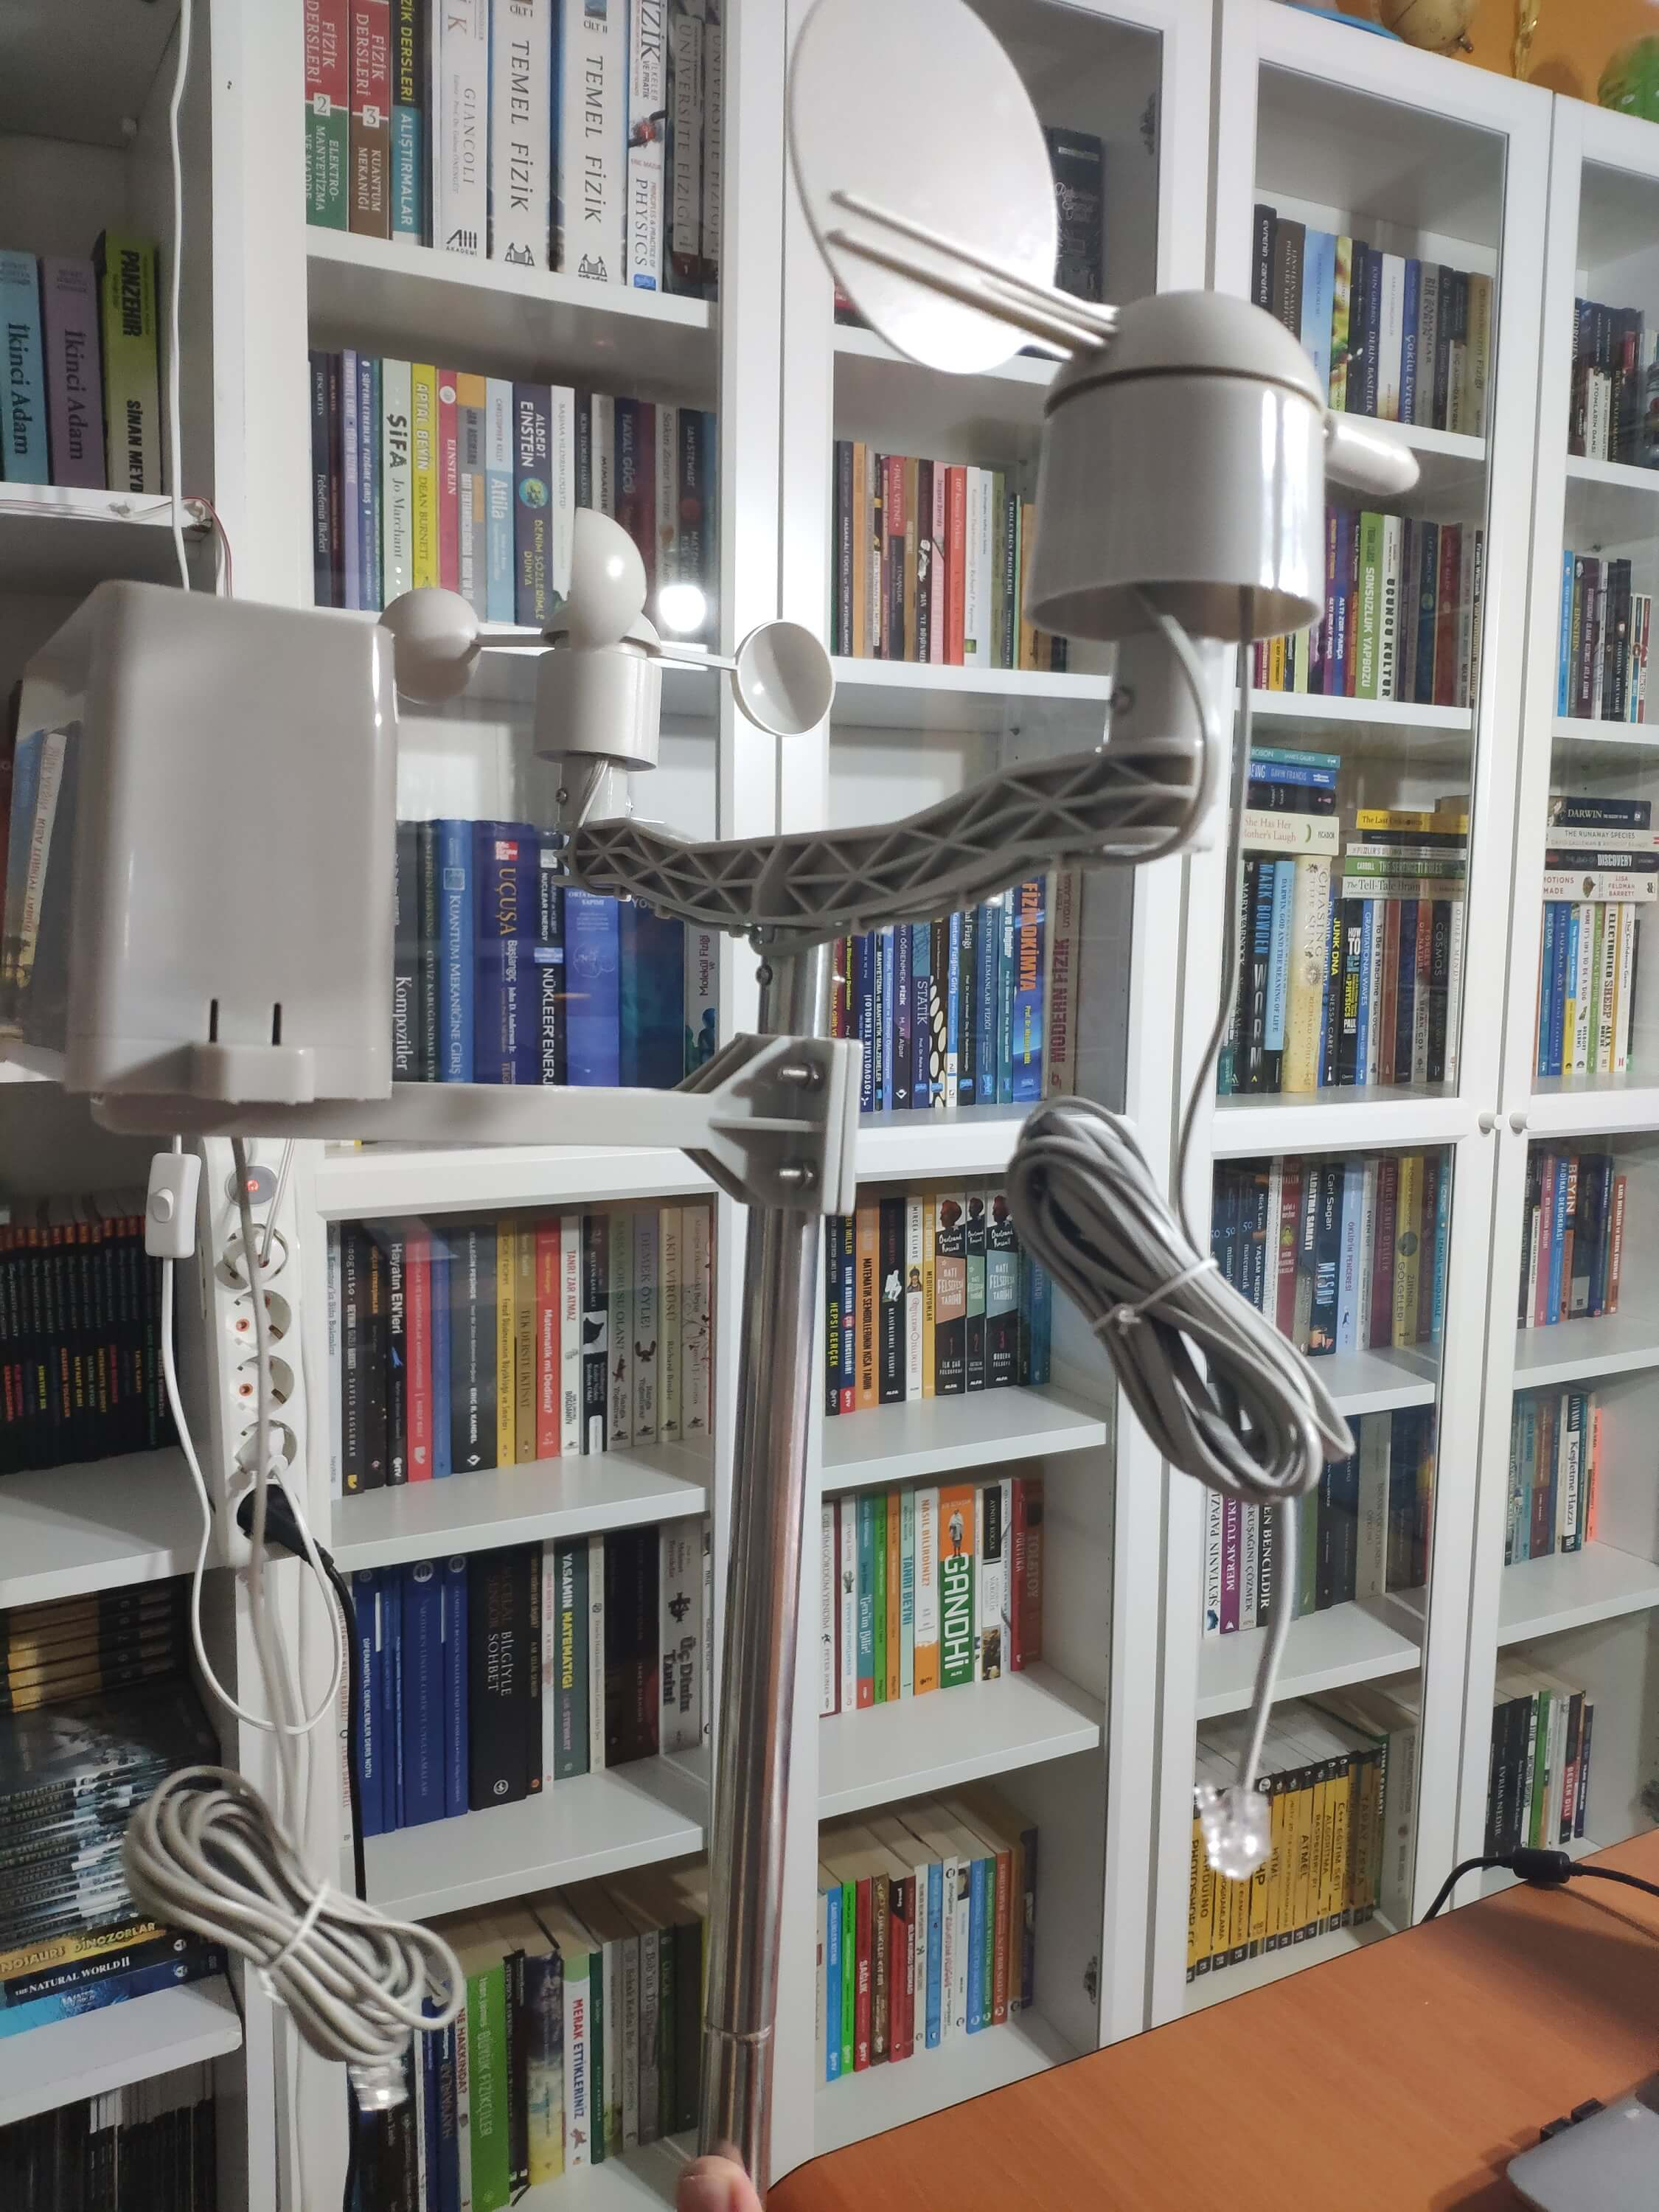
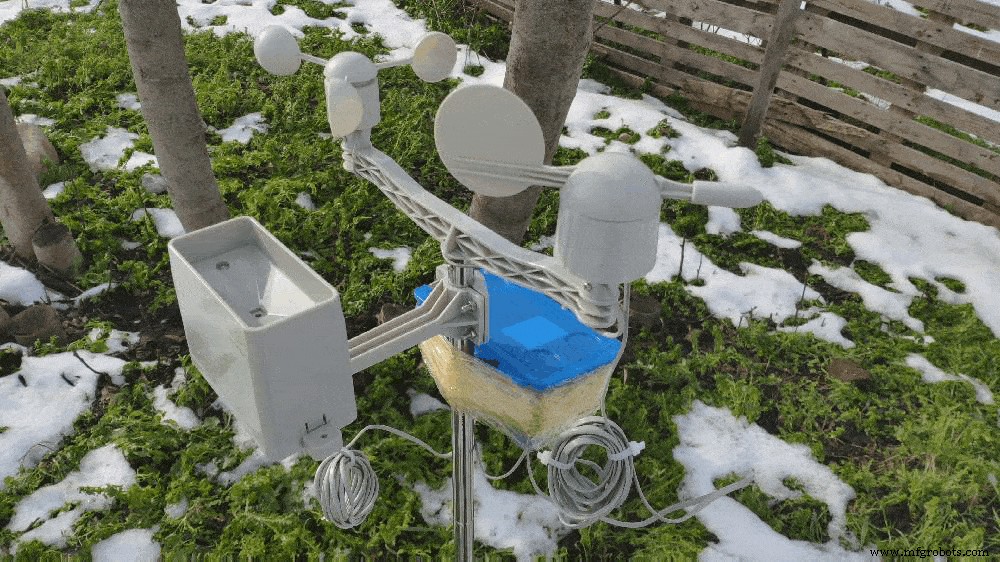
⭐ Agora, ele está pronto para coletar dados meteorológicos, mesmo em condições climáticas extremas. No entanto, a placa do sensor (conversor) não é à prova de intempéries, então adicionei uma caixa de plástico à estação meteorológica para proteger a placa do sensor e a blindagem do SIM808 ao ar livre.
Etapa 2:coleta de dados meteorológicos no Planilhas Google
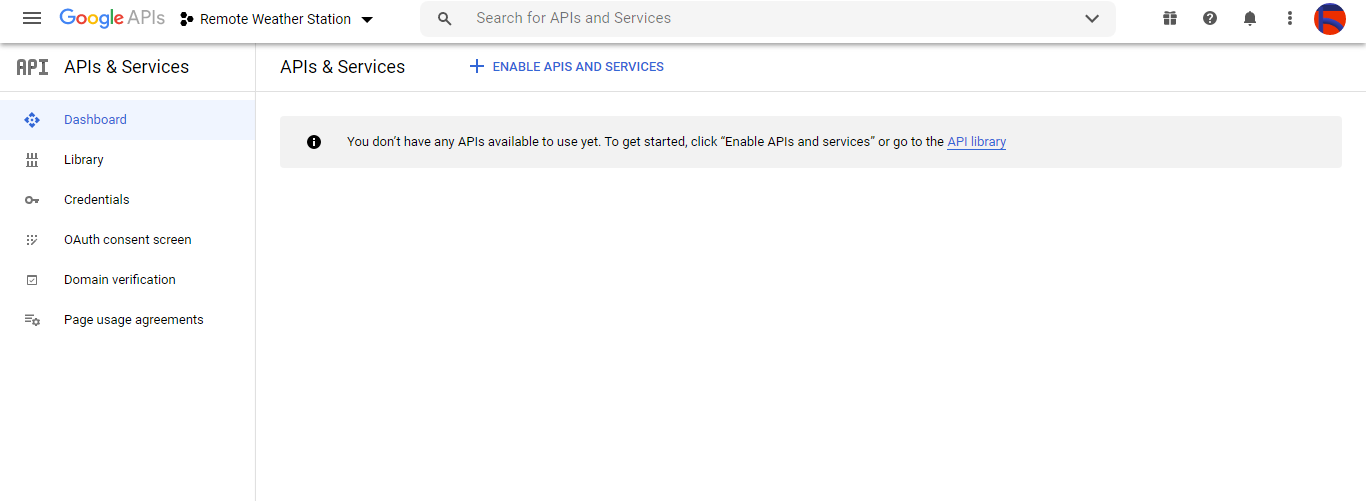
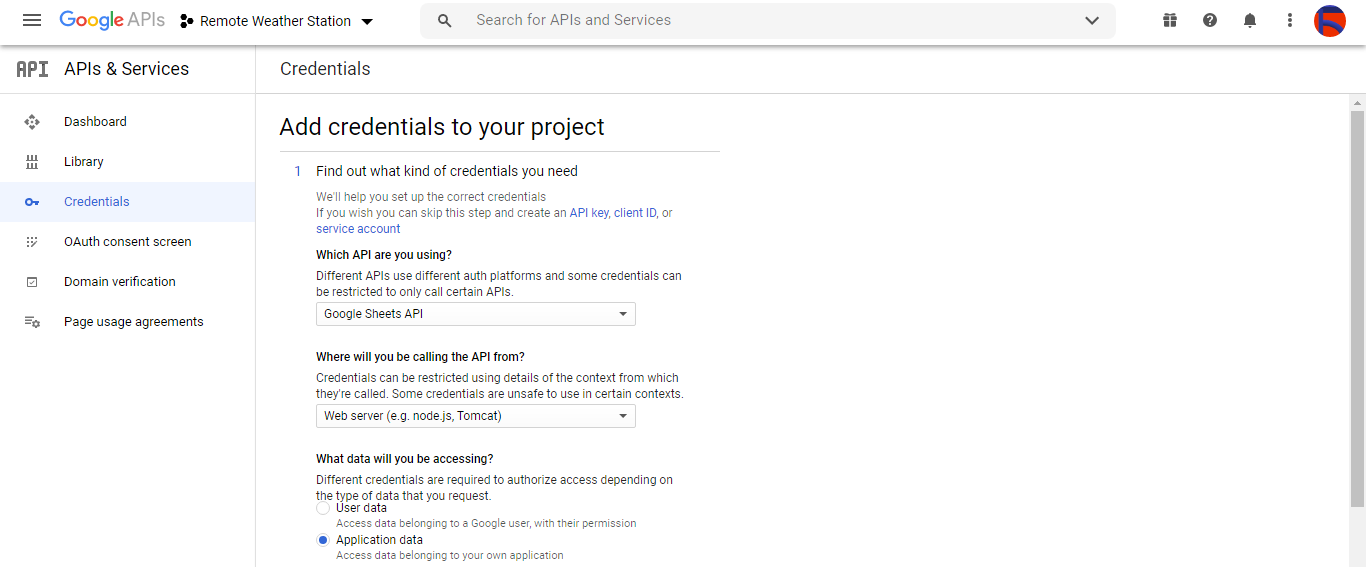
Para enviar informações para uma planilha no Planilhas Google, você precisa criar um novo aplicativo no Console do desenvolvedor do Google e obter credenciais de verificação para utilizar a API do Planilhas Google. Se você é um novato na criação de aplicativos com o Google Developer Console, siga as instruções abaixo.
⭐ Vá para o Google Developer Console e clique no botão 'NOVO PROJETO'. Insira o nome do projeto como Estação Meteorológica Remota .

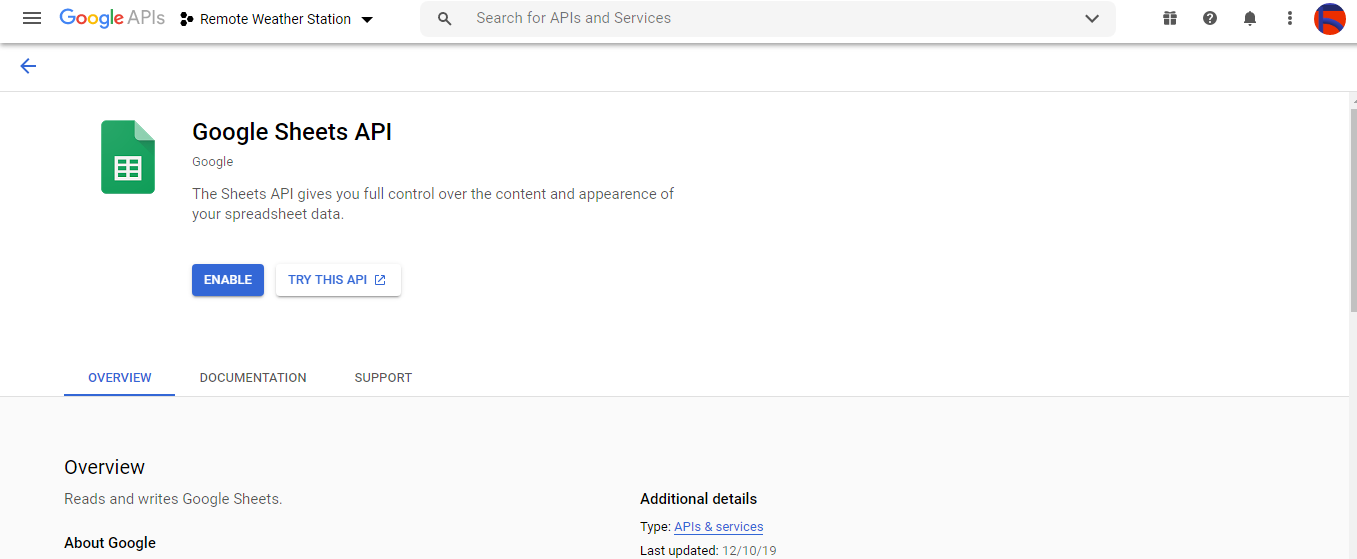
⭐ Vá para APIs e serviços e clique na biblioteca da API para ativar a API do Planilhas Google.
Etapa 2.1:Como obter credenciais para usar a API do Planilhas Google
⭐ Abra o painel do projeto e clique em Credenciais botão. Em seguida, preencha o formulário conforme ilustrado abaixo para criar a conta de serviço e a chave.
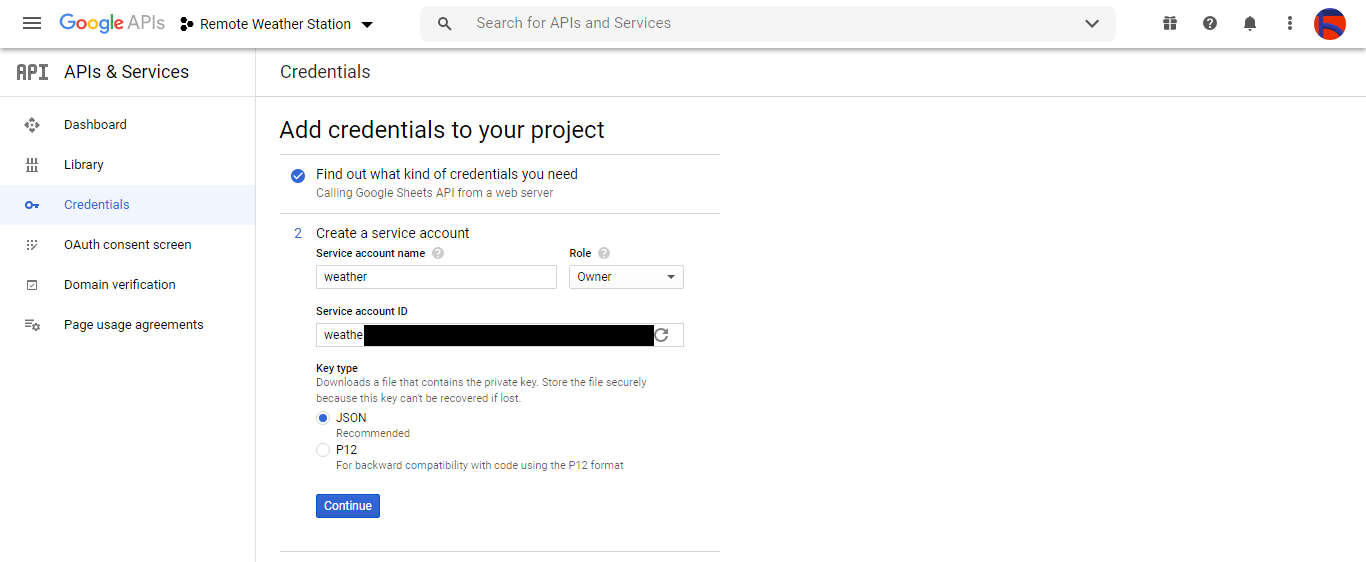
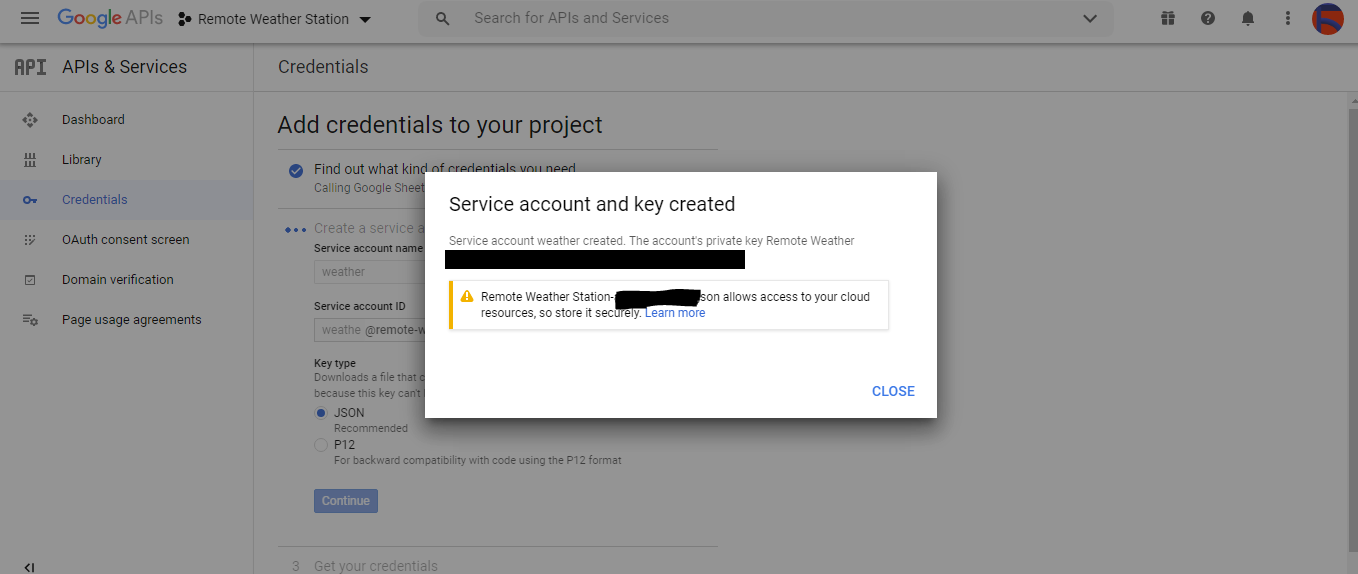
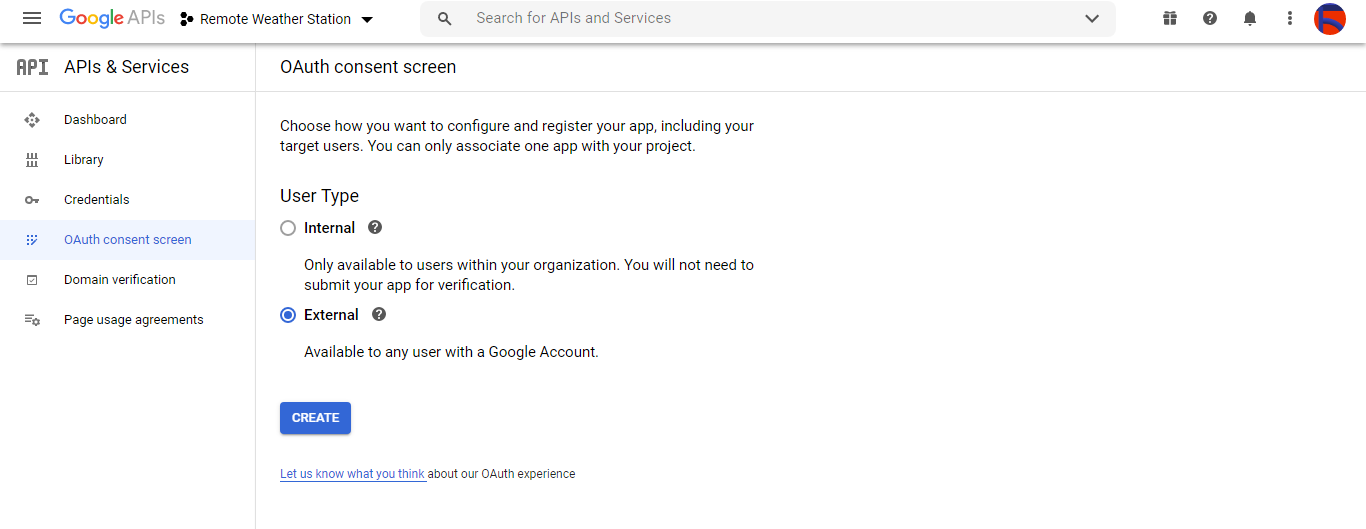
⭐ Clique em CRIAR CREDENCIAIS botão e configure a tela de consentimento para poder criar um ID de cliente OAuth.
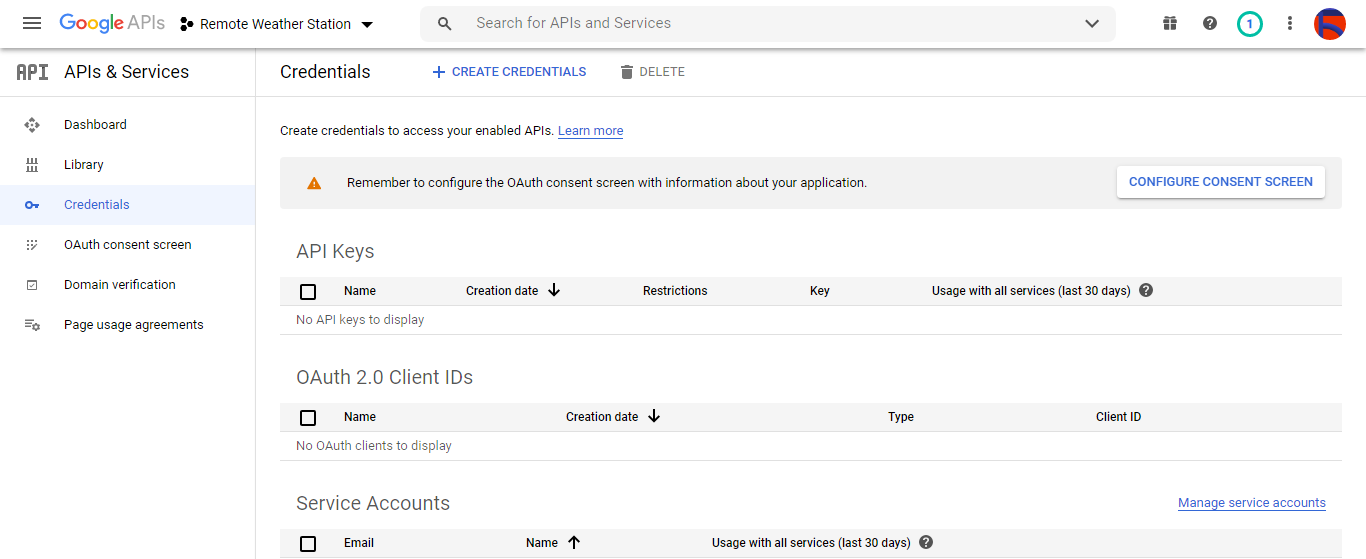
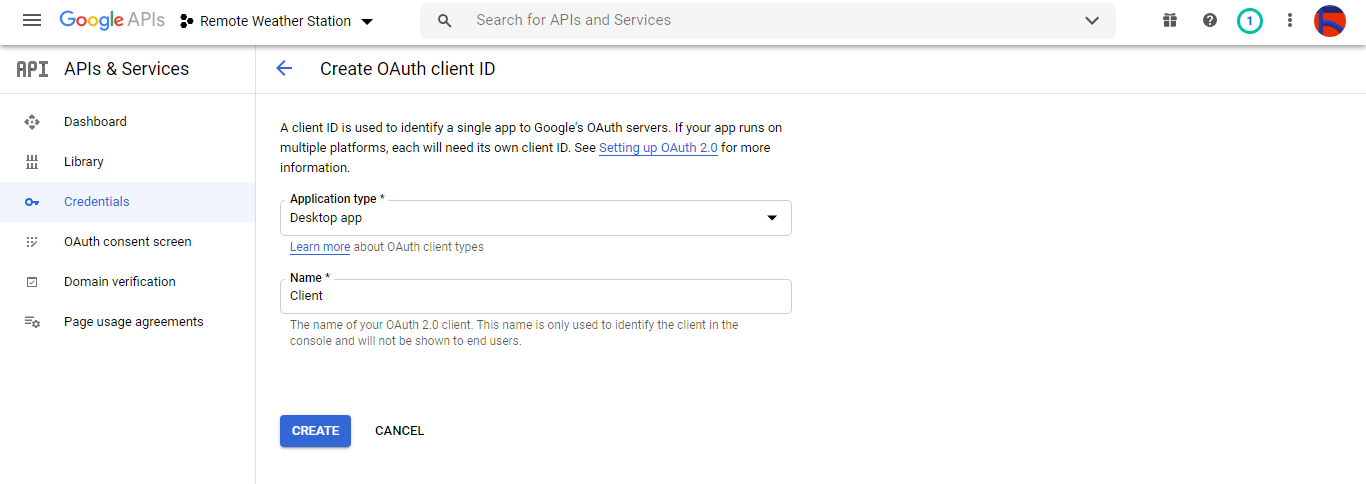
⭐ Em seguida, crie um novo ID de cliente OAuth denominado Cliente em Aplicativo para desktop (tipo de aplicação).
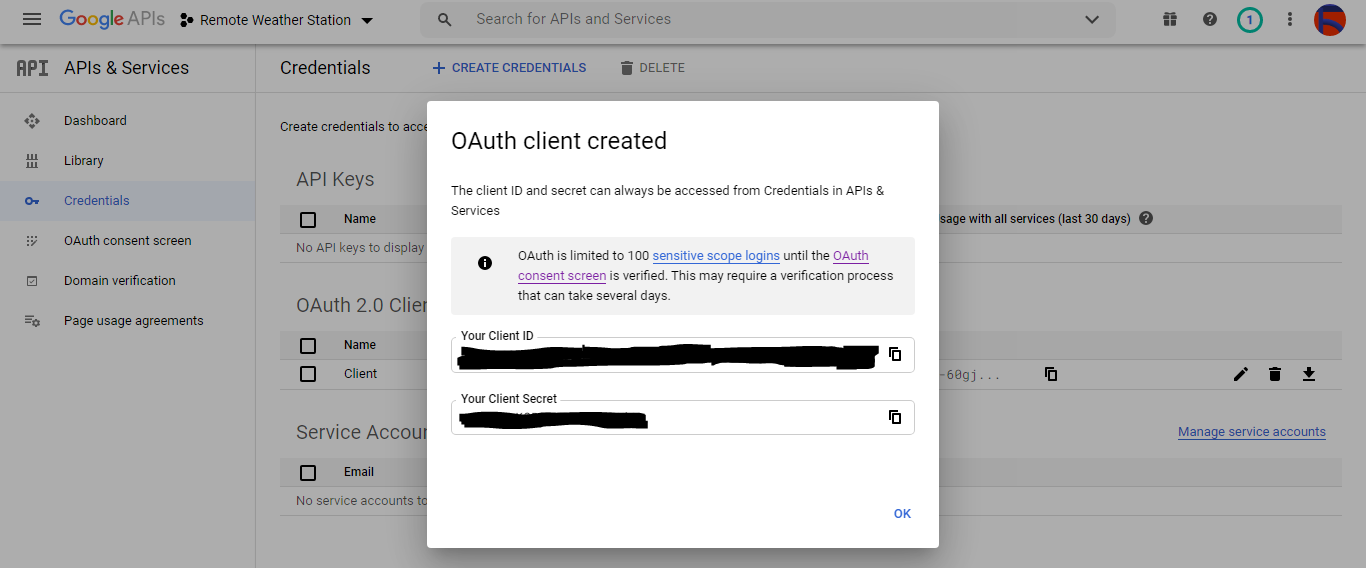
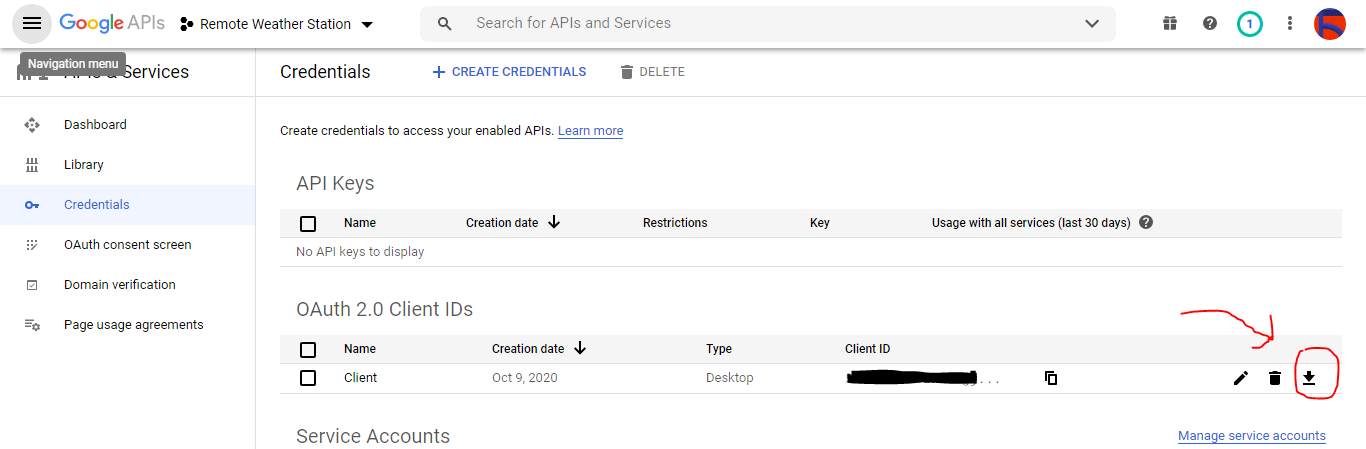
⭐ Depois de criar o ID do cliente OAuth (Cliente) baixe as credenciais (ID e segredo) e nomeie o arquivo como credentials.json .
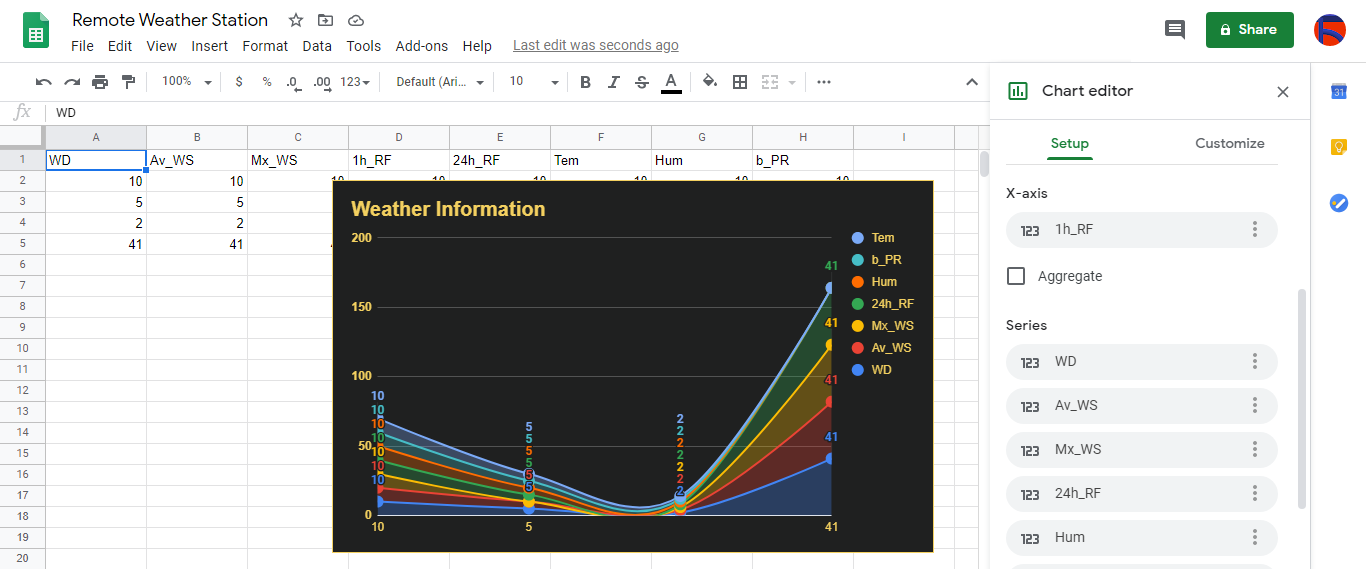
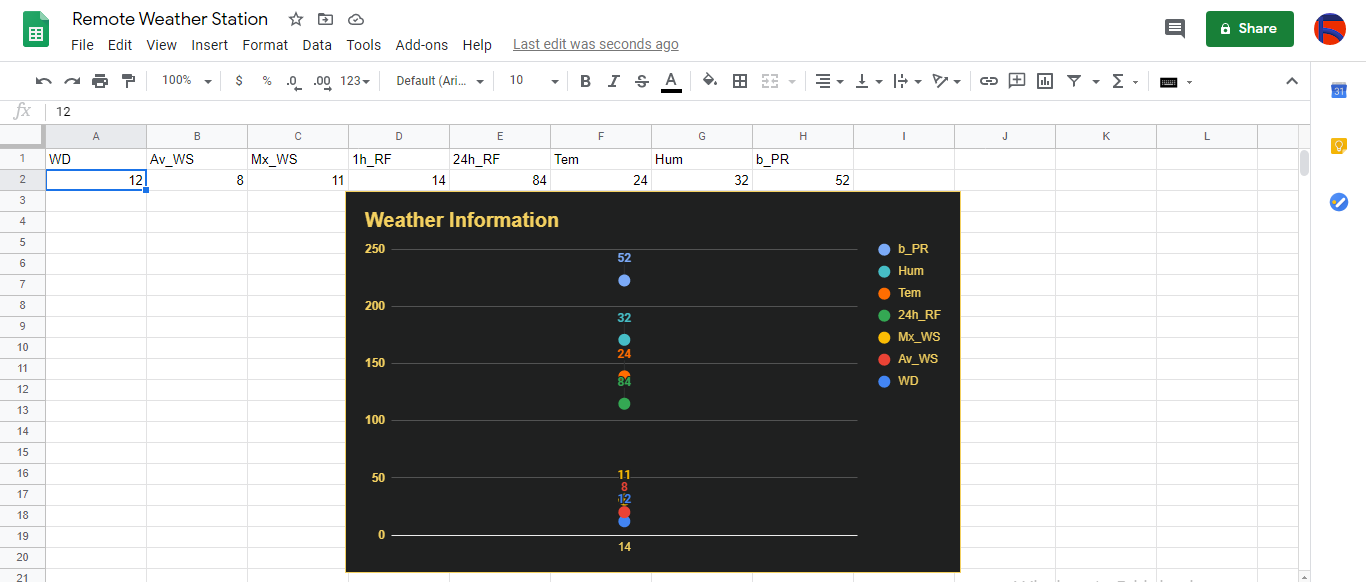
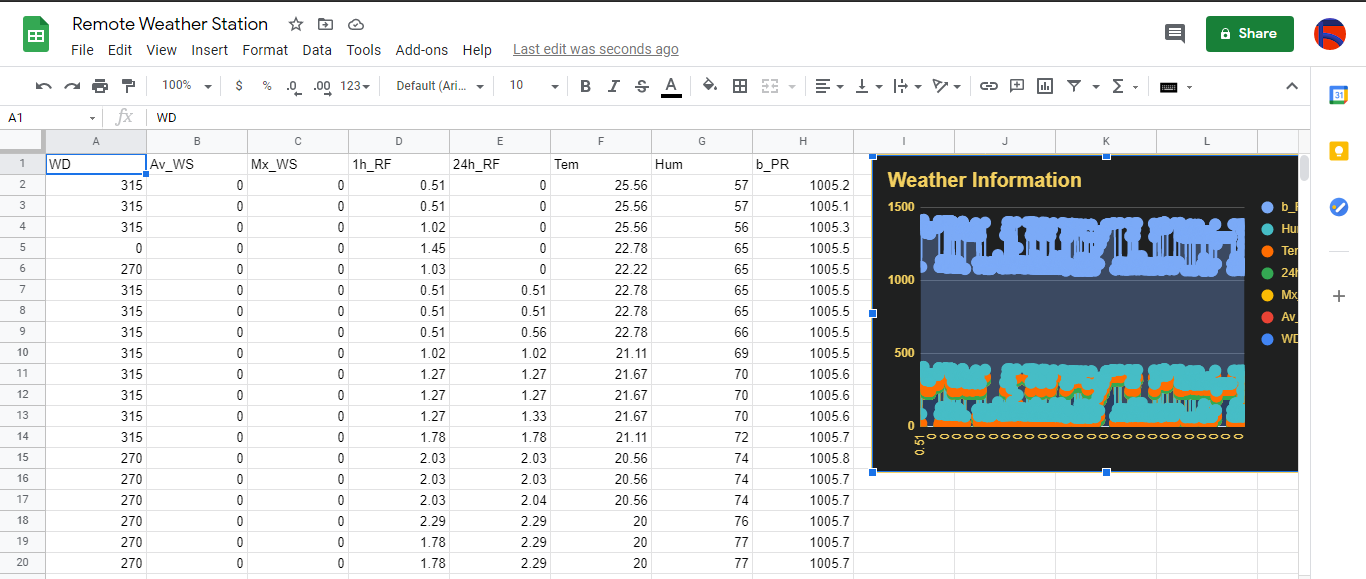
Etapa 2.2:Criação de uma planilha no Planilhas Google
⭐ Vá para o Planilhas Google e selecione Pessoal .

⭐ Crie um em branco planilha e nomeie-a Estação meteorológica remota .
⭐ Em seguida, defina os nomes das colunas como a primeira linha:
- WD
- Av_WS
- Mx_WS
- 1h_RF
- 24h_RF
- Tem
- Hum
- b_PR
⭐ Se necessário, modifique um gráfico para inspecionar os dados coletados, como eu fiz.
Etapa 3:desenvolver um aplicativo da web em PHP para anexar dados meteorológicos à planilha
Este aplicativo da web PHP é para obter dados meteorológicos transferidos pelas placas de desenvolvimento (ESP8266 e SIM808) por meio de uma solicitação HTTP Get e anexar esses dados a uma determinada planilha (por ID) no Planilhas Google com credenciais e token verificados.
O aplicativo da web requer que a biblioteca cliente do Google para PHP anexe dados meteorológicos a uma determinada planilha no Planilhas Google.
⭐ Portanto, em primeiro lugar, crie uma pasta chamada remote_weather_station em seu servidor e instale nele a biblioteca cliente do Google para PHP.
A remote_weather_station A pasta deve incluir estes quatro arquivos, além da biblioteca cliente do Google para funcionar:
- index.php
- account_verification_token.php
- credentials.json (Etapa 2.1)
- token.json (Etapa 3.1)
Nesta etapa, discutirei os primeiros dois arquivos - index.php e account_verification_token.php:
💻 index.php
⭐ Obtenha dados meteorológicos locais da estação meteorológica por meio de uma solicitação Get:
  // Direção do vento (wd), velocidade média do vento (a_ws), velocidade máxima do vento (m_ws), chuva de 1 hora (1_rf), chuva de 24 horas (24_rf), temperatura (tem), umidade (hum), Pressão barométrica (b_pr).
 $ variables_from_module;
 if (isset ($ _ GET ['wd']) &&isset ($ _ GET ['a_ws']) &&isset ($ _ GET ['m_ws'] ) &&isset ($ _ GET ['1_rf']) &&isset ($ _ GET ['24_rf']) &&isset ($ _ GET ['tem']) &&isset ($ _ GET ['hum']) &&isset ($ _ GET ['b_pr'])) {
 $ variables_from_module =[
 "wd" => (int) $ _ GET ['wd'],
 "a_ws" => (float) $ _ GET ['a_ws'],
 "m_ws" => (float) $ _ GET ['m_ws'],
 "1_rf" => (float) $ _ GET ['1_rf'],
 "24_rf" => (float) $ _ GET ['24_rf'],
 "tem" => (float) $ _ GET ['tem'],
 "hum" => (int) $ _ GET ['hum'],
 "b_pr" => (float) $ _ GET ['b_pr']
];
} else {
 $ variables_from_module =[
 "wd" => "errar",
 "a_ws" => "errar",
 "m_ws" => "errar",
 "1_rf" => "errar",
 "24_rf" => "errar",
 "tem" => "errar",
 "hum" => "errar",
 "b_pr" => "errar"
];
}
⭐ Conecte-se ao aplicativo Google Developer Console chamado Remote Weather Station usando o credentials.json arquivo (Etapa 2.1) .
  $ client =new Google_Client ();
 $ client-> setApplicationName ('Remote Weather Station'); // Insira o nome do seu aplicativo.
 $ client-> setScopes ('https://www.googleapis.com/auth/spreadsheets');
 $ client-> setAuthConfig ('credentials.json');
 $ client-> setAccessType ('offline');
 $ client-> setPrompt ('select_account consent');
⭐ Carregue o token autorizado anteriormente de um arquivo ( token.json ), se existir.
  $ tokenPath ='token.json';
 if (file_exists ($ tokenPath)) {
 $ accessToken =json_decode (file_get_contents ($ tokenPath), true);
 $ client-> setAccessToken ($ accessToken);
 print ("Token encontrado!");
}
⭐ Se não houver token anterior ou expirado, solicite autorização do usuário e defina o código de verificação para criar o token.json arquivo com o file_put_contents () função.
if ($ client-> isAccessTokenExpired ()) {
// Atualize o token se possível, caso contrário, busque um novo.
if ($ client-> getRefreshToken ()) {
$ client-> fetchAccessTokenWithRefreshToken ($ client-> getRefreshToken ());
} else {
// Solicitar autorização do usuário.
$ authUrl =$ client-> createAuthUrl ();
...
// Defina o código de verificação para criar o token.json.
$ authCode =trim ($ GLOBALS ['account_verification_token' ]);
...
// Verifique se houve um erro e o account_verification_token foi inserido.
if (array_key_exists ('error', $ accessToken)) {
throw new Exception (join (',', $ accessToken));
} else {
print ("Bem-sucedido! Atualizar a página.");
}
}
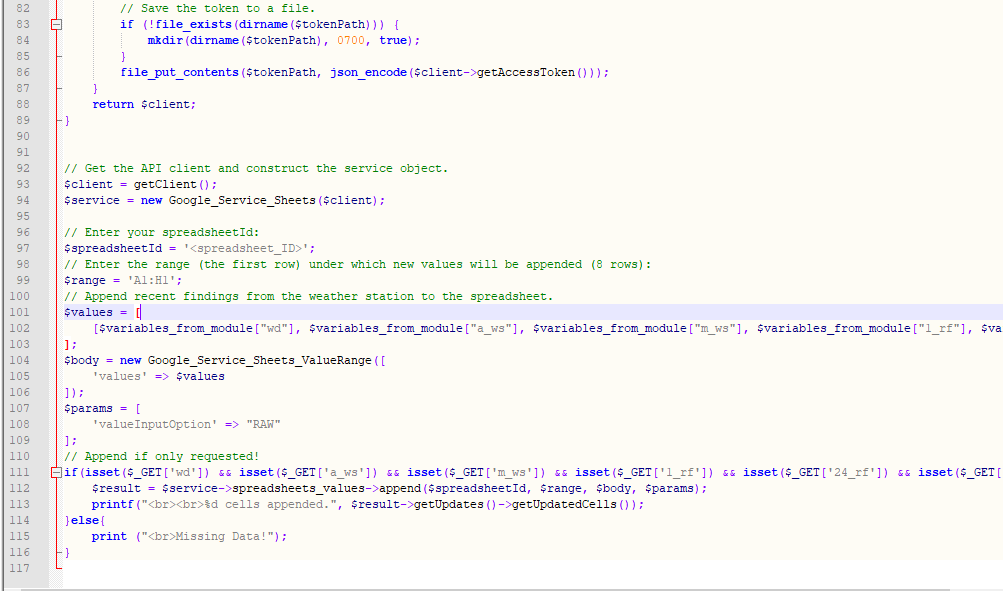
// Salve o token em um arquivo.
if (! file_exists (dirname ($ tokenPath))) {
mkdir (dirname ($ tokenPath), 0700 , verdadeiro);
}
file_put_contents ($ tokenPath, json_encode ($ client-> getAccessToken ()));
} ⭐ Insira o ID da planilha e o intervalo para anexar as descobertas recentes da estação meteorológica à planilha.
https://docs.google.com/spreadsheets/d/spreadsheetId/edit#gid=0
// Insira seu spreadsheetId:
$ spreadsheetId ='';
// Insira o intervalo (a primeira linha) sob o qual novos valores serão acrescentados (8 linhas) :
$ range ='A1:H1';
// Anexar descobertas recentes da estação meteorológica à planilha.
$ values =[
[$ variables_from_module ["wd" ], $ variables_from_module ["a_ws"], $ variables_from_module ["m_ws"], $ variables_from_module ["1_rf"], $ variables_from_module ["24_rf"], $ variables_from_module ["tem"], $ variables_from_module ["hum"], $ variables_from_module ["b_pr"]]
];
$ body =new Google_Service_Sheets_ValueRange ([
'valores' => $ valores
]);
$ params =[
'valueInputOption' => "RAW"
];
...
$ resultado =$ serviço-> spreadsheets_values-> append ( $ spreadsheetId, $ range, $ body, $ params);
printf ("
% d células anexadas.", $ result-> getUpdates () -> getUpdatedCells ()); 💻 account_verification_token.php
⭐ Após autorizar o aplicativo da web pelo AuthUrl criado , insira o código de verificação fornecido para definir um token de acesso.
$ account_verification_token =""; // Insira o código de verificação após a autorização. 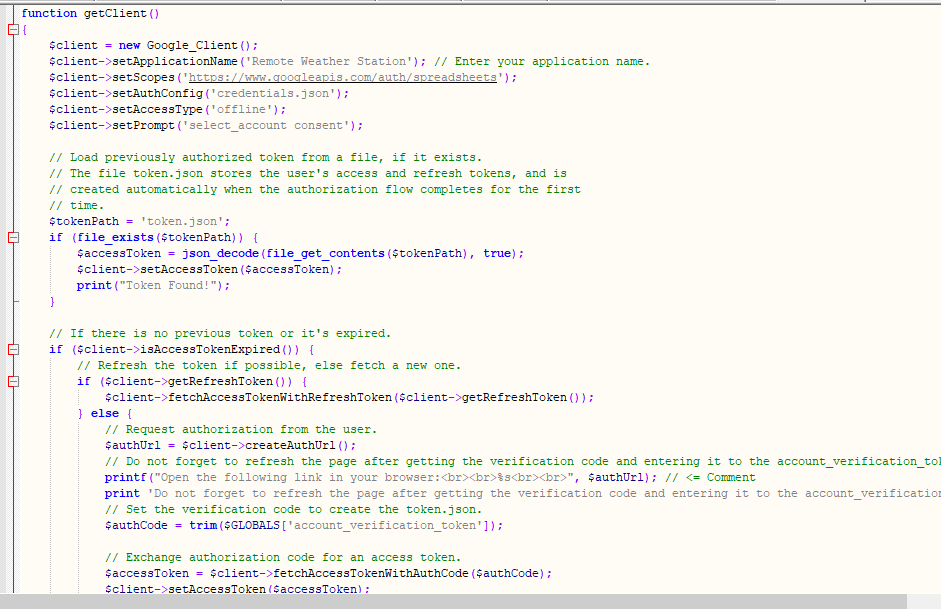
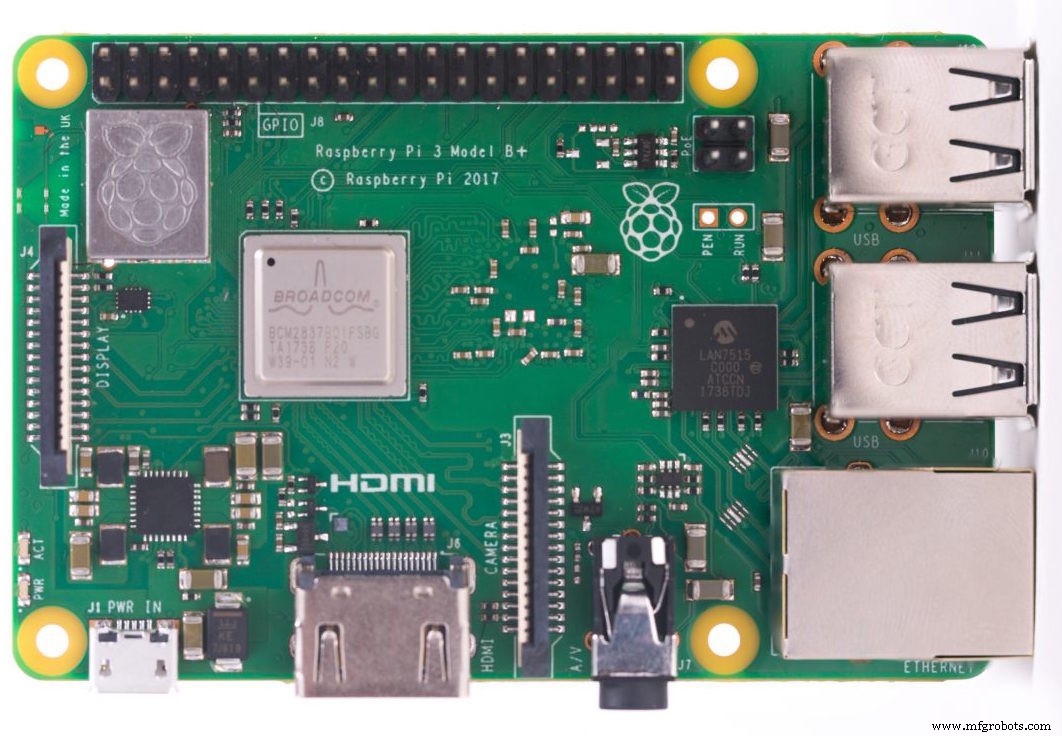
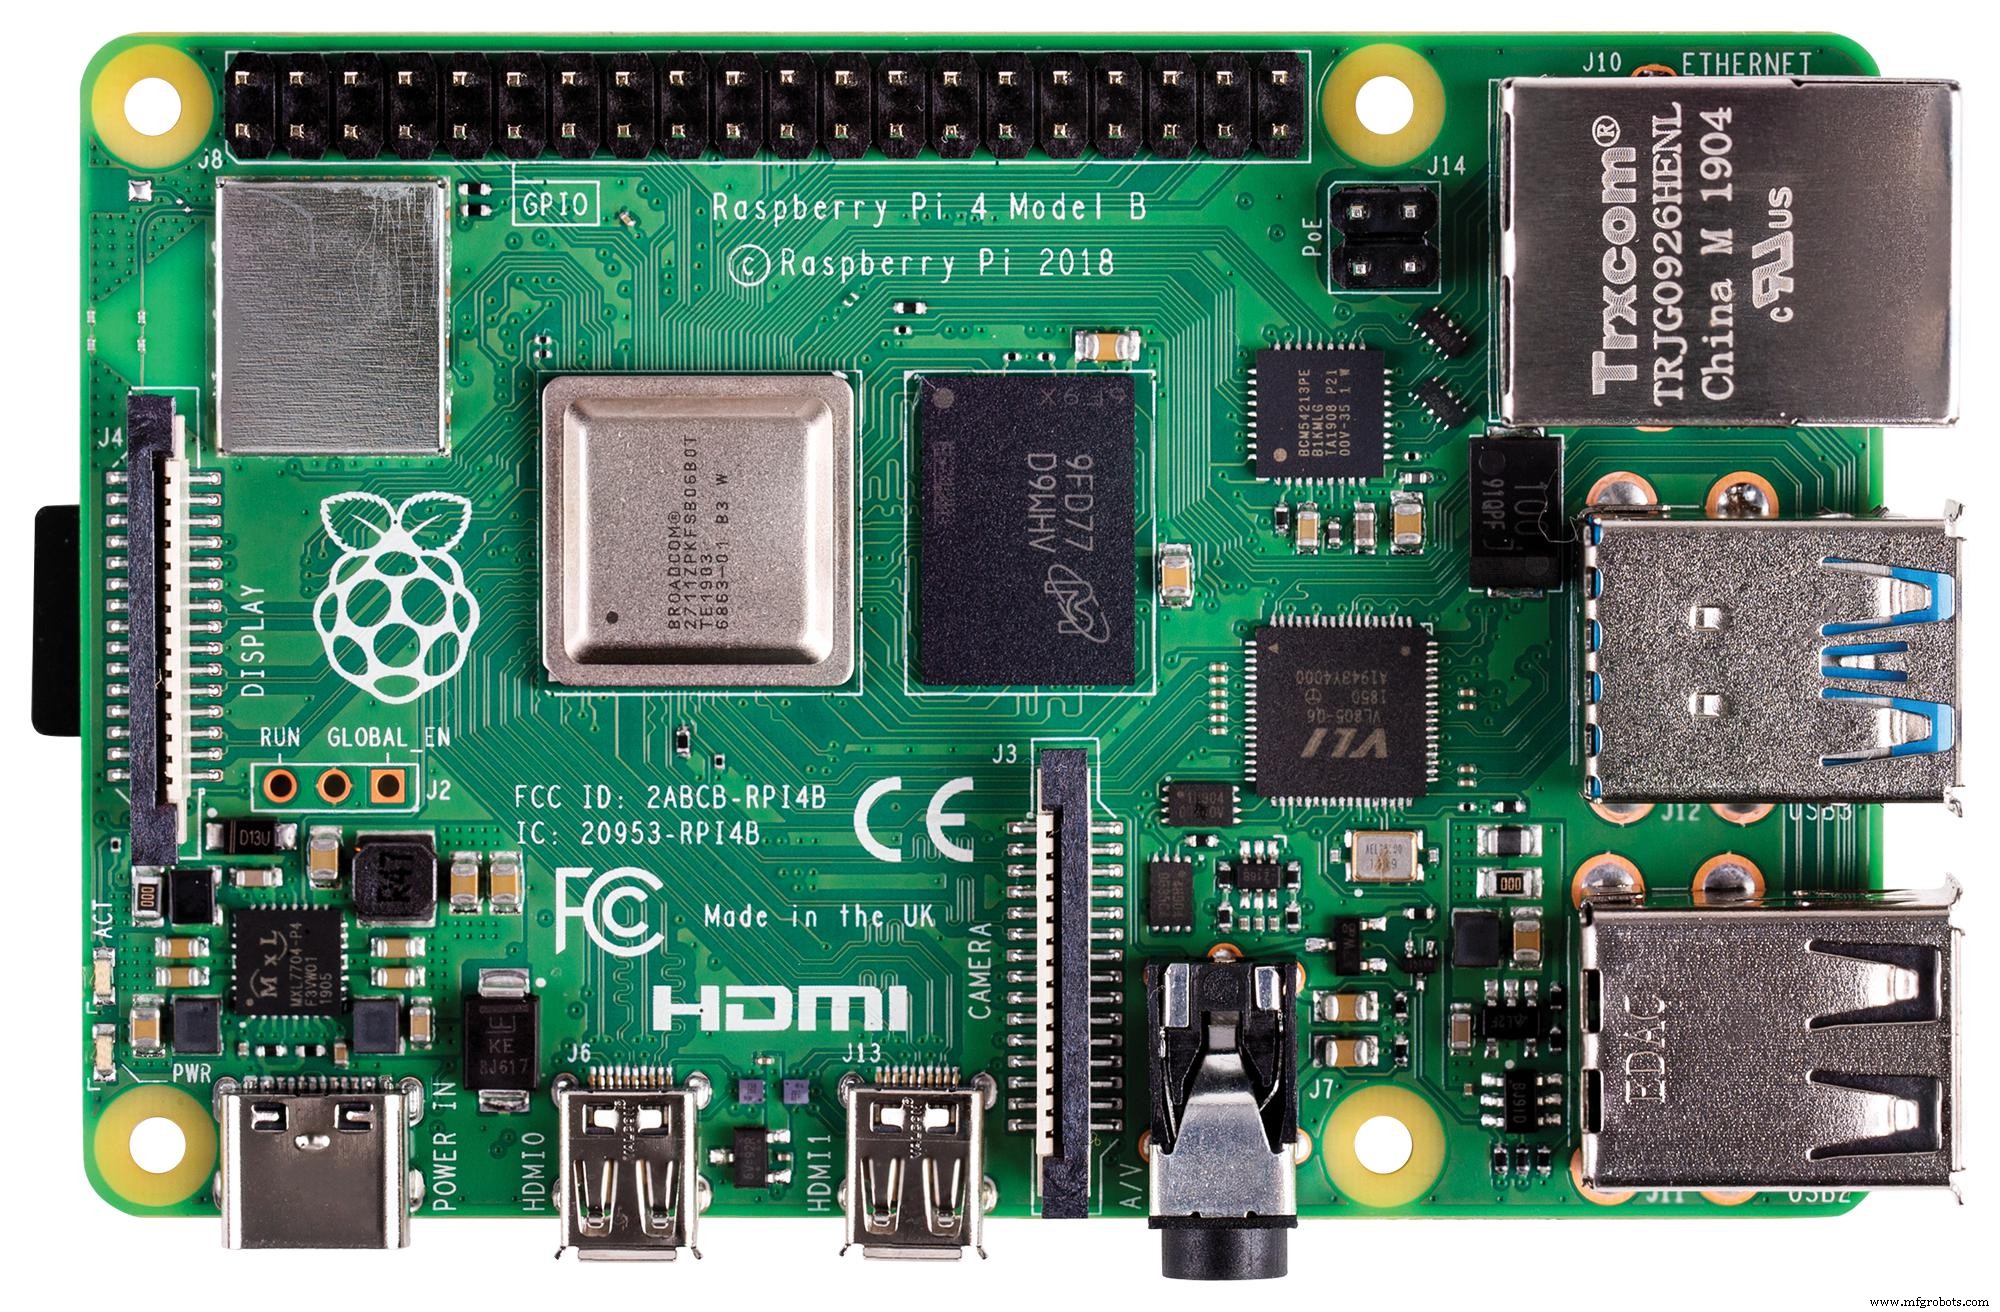
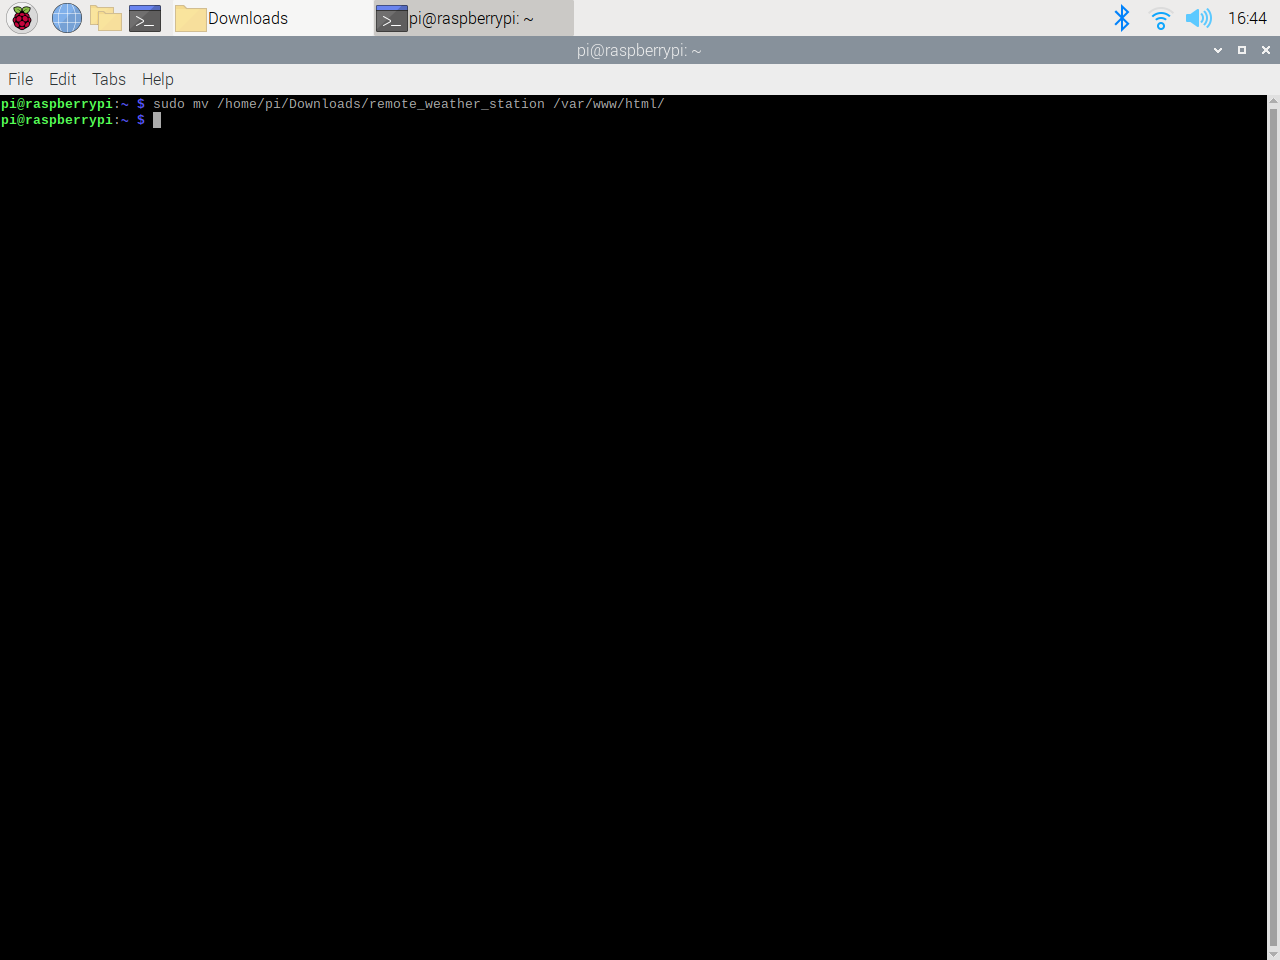
Etapa 3.1:Configurando o aplicativo da web no Raspberry Pi (ou qualquer servidor)
Depois de criar o aplicativo da web PHP, decidi executá-lo no meu Raspberry Pi, mas você pode executar o aplicativo em qualquer servidor, desde que seja um servidor PHP.
Se você deseja usar o Raspberry Pi, mas não sabe como configurar um servidor da web LAMP no Raspberry Pi, pode inspecionar este tutorial.
⭐ Em primeiro lugar, mova a pasta do aplicativo (remote_weather_station) para o servidor apache (/ var / www / html) usando o terminal, pois o servidor apache é um local protegido.
sudo mv / home / pi / Downloads / remote_weather_station / var / www / html /
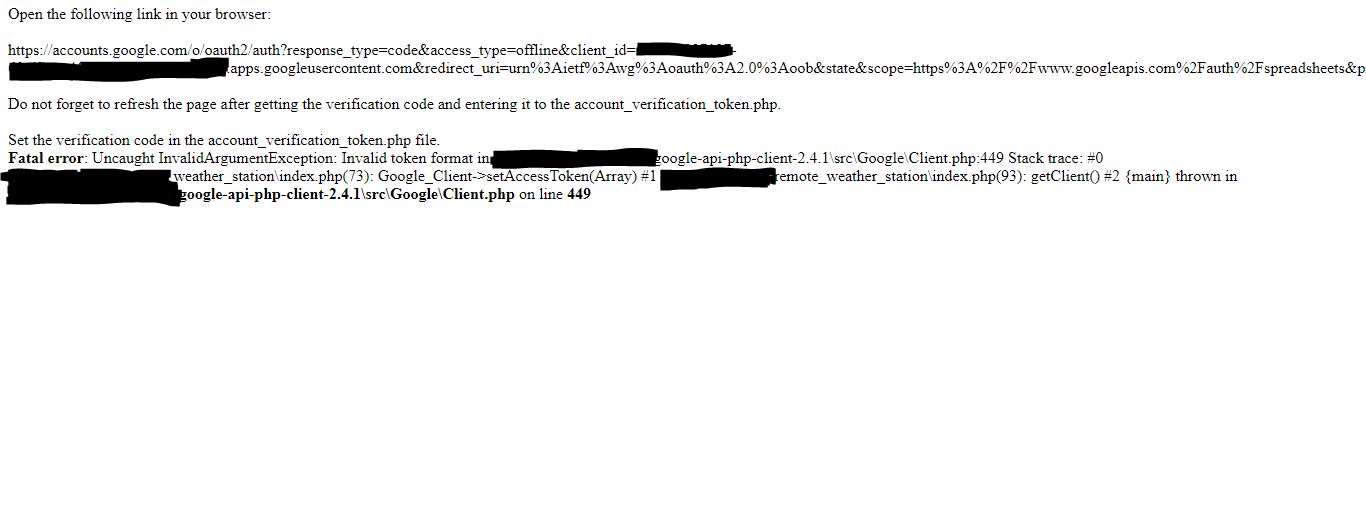
⭐ O aplicativo da web gera um erro ao ser aberto pela primeira vez devido ao código de verificação ausente. Para obter o código de verificação, acesse o link de autorização gerado pelo aplicativo.
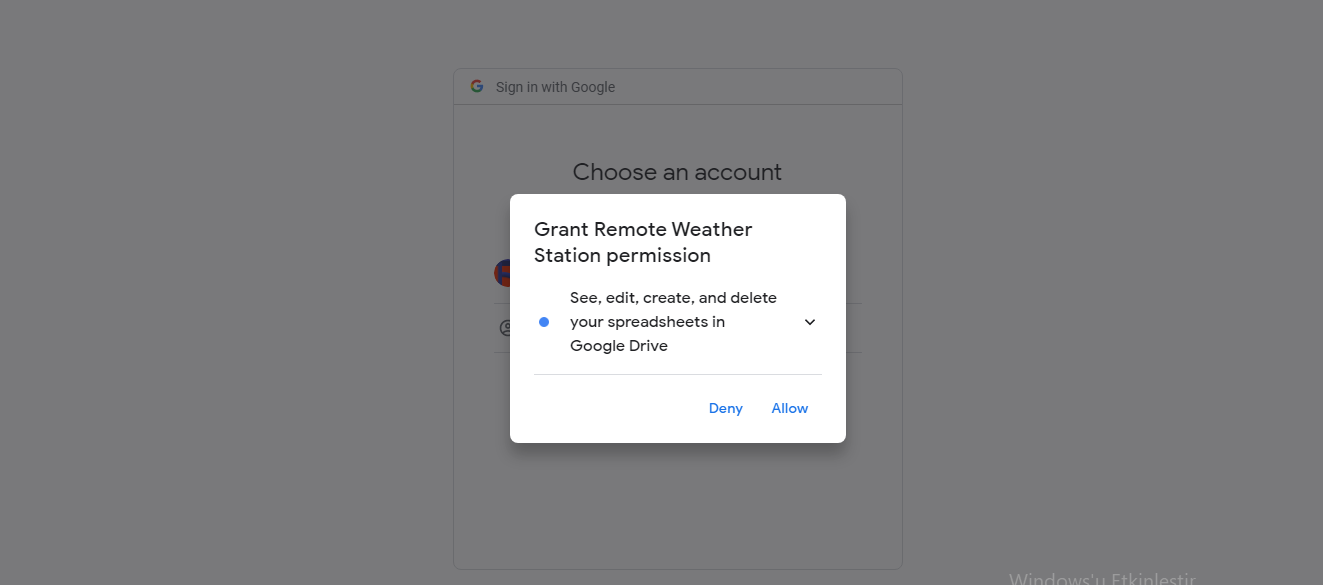
⭐ Em seguida, clique em Ir para Estação Meteorológica Remota (inseguro) .
⭐ Conceda o aplicativo com as permissões necessárias.
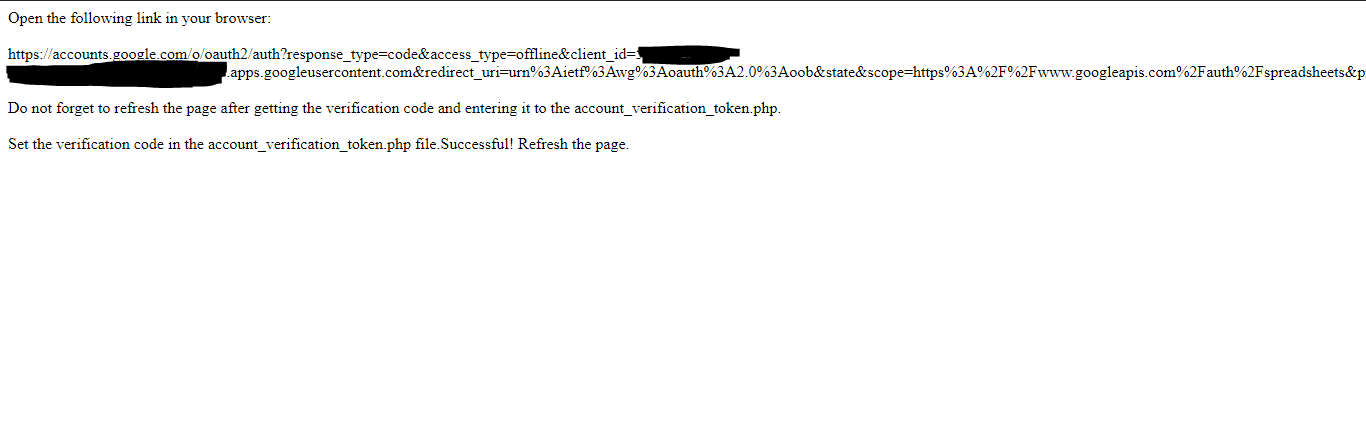
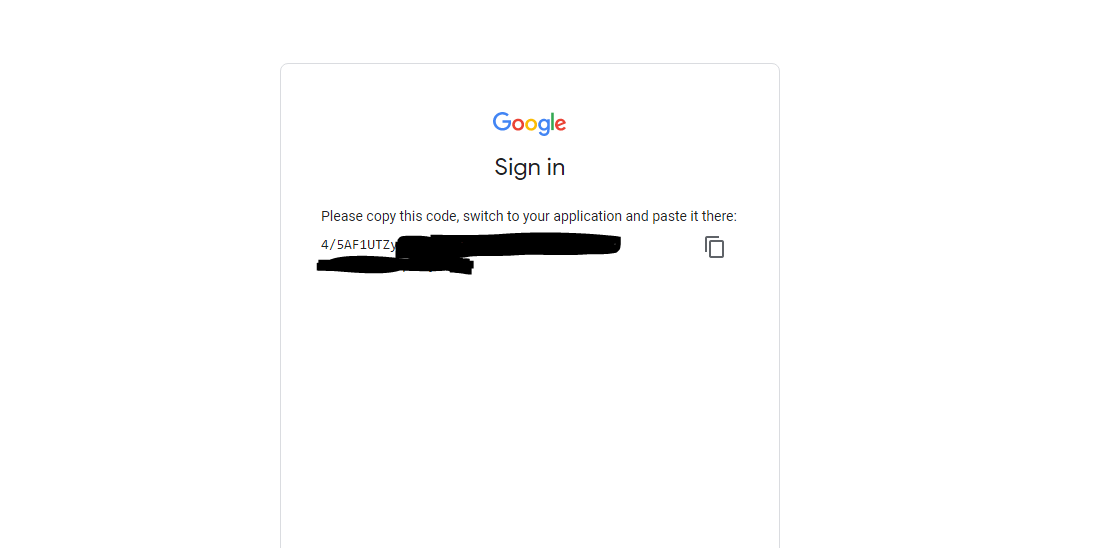
⭐ Agora, copie o código de verificação e cole-o em account_verification_token.php .
⭐ Retorne ao aplicativo da web. Ele deve exibir a mensagem de confirmação: Sucesso! Atualize a página .
⭐ Depois de atualizar a página, o aplicativo da web usa o código de verificação para obter um token de acesso e salva o token de acesso em um arquivo denominado token.json . Assim, ele não gera um erro novamente.

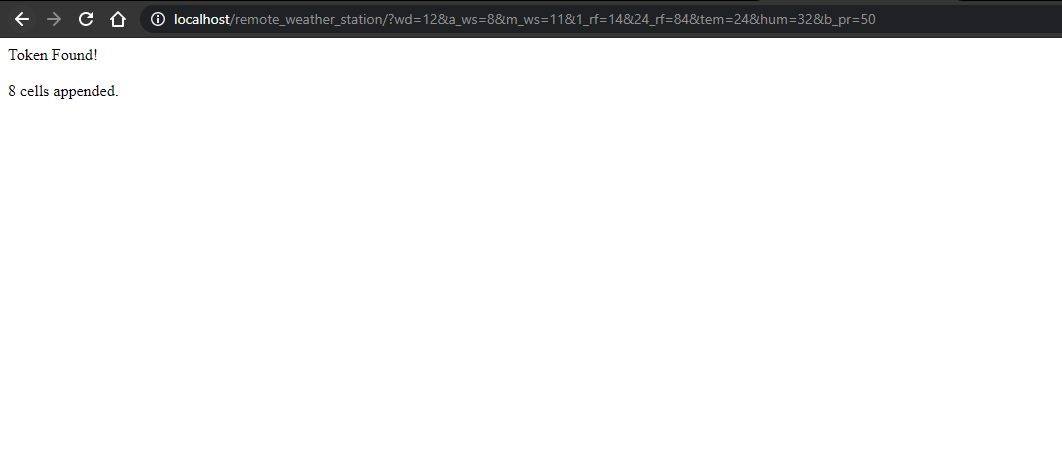
⭐ Para testar se o aplicativo da web PHP está anexando novos dados à planilha fornecida com precisão:
http:// localhost / remote_weather_station /? wd =12 &a_ws =8 &m_ws =11 &1_rf =14 &24_rf =84 &tem =24 &hum =32 &b_pr =57
Etapa 4:leitura e envio de dados meteorológicos com ESP8266 (WiFi)
Para coletar dados meteorológicos na minha varanda, usei uma placa de desenvolvimento NodeMCU ESP-12E (ESP8266) com a estação meteorológica.
Eu o programei para enviar dados meteorológicos para o aplicativo da web PHP a cada cinco minutos.

⭐ Inclua as bibliotecas necessárias e defina as configurações de WiFi.
  #include
 #include
 #include
 #include
 #include

 // Defina suas configurações de WiFi.
 const char * ssid ="";
 const char * password =" ";
⭐ Defina as configurações da estação meteorológica e os pinos de conexão serial - D6, D5.
  // Definir as configurações da estação meteorológica:
 char databuffer [35];
 double temp;
 int transferring =0;

 // Definir os pinos de conexão serial - RX e TX.
 SoftwareSerial Serial_1 (D6, D5); // (Rx, Tx)
⭐ No getBuffer () função, obter dados da estação meteorológica.
  void getBuffer () {
 índice interno;
 para (índice =0; índice <35; índice ++) {
 if (Serial_1.available ()) {
 databuffer [index] =Serial_1.read ();
 if (databuffer [0]! ='c') {
 index =-1;
}
 }
 else {
 índice -;
}
}
}
⭐ Depure os dados meteorológicos e crie o link.
  String weather_data ="wd =" + String (WindDirection ()) + "&a_ws =" + String (WindSpeedAeciation ()) + "&m_ws =" + String (WindSpeedMax ()) + "&1_rf =" + String (RainfallOneHour ()) + "&24_rf =" + String (RainfallOneDay ()) + "&tem =" + String (Temperatura ()) + "&hum =" + String (Humidity ()) + "&b_pr =" + String ( BarPressure ());
 String server ="http://192.168.1.24/remote_weather_station/?";

 ...

 int WindDirection () { retornar transCharToInt (databuffer, 1,3); } // Direção do vento (deg)

 float WindSpeedA hundred () {temp =0.44704 * transCharToInt (databuffer, 5,7); return temp; } // Velocidade média do ar (1 minuto)

 float WindSpeedMax () {temp =0,44704 * transCharToInt (databuffer, 9,11); return temp; } // Velocidade máxima do ar (5 minutos)

 Temperatura flutuante () {temp =(transCharToInt (databuffer, 13,15) - 32,00) * 5,00 / 9,00; return temp; } // Temperatura ("C")

 float RainfallOneHour () {temp =transCharToInt (databuffer, 17,19) * 25,40 * 0,01; return temp; } // Rainfall (1 hora)

 float RainfallOneDay () {temp =transCharToInt (databuffer, 21,23) * 25,40 * 0,01; return temp; } // Precipitação (24 horas)

 int Umidade () {return transCharToInt (databuffer, 25,26); } // Umidade (%)

 float BarPressure () {temp =transCharToInt (databuffer, 28,32); temperatura de retorno / 10,00; } // Pressão Barométrica (hPA)
⭐ Envie pacotes de dados a cada 5 minutos para Raspberry Pi (ou qualquer servidor).
  transferindo ++; Serial.println ("Time =>" + String (transferindo) + "s /" + String (int (5 * 60)) + "s \ n \ n");
 if (transferindo ==5 * 60) {
 // Crie o objeto HTTP para fazer uma solicitação ao servidor.
 HTTPClient http;
 http.begin (servidor + dados_do_ clima);
 int httpCode =http.GET ();
 Carga útil da string =http.getString ();
 Serial.println ("Envio de dados ... \ nCódigo HTTP =>" + String (httpCode) + "\ nServer Response =>" + carga útil + "\ n \ n");
 http.end ();
 transferindo =0;
 }
 // Wait 1 second...
delay(1000); 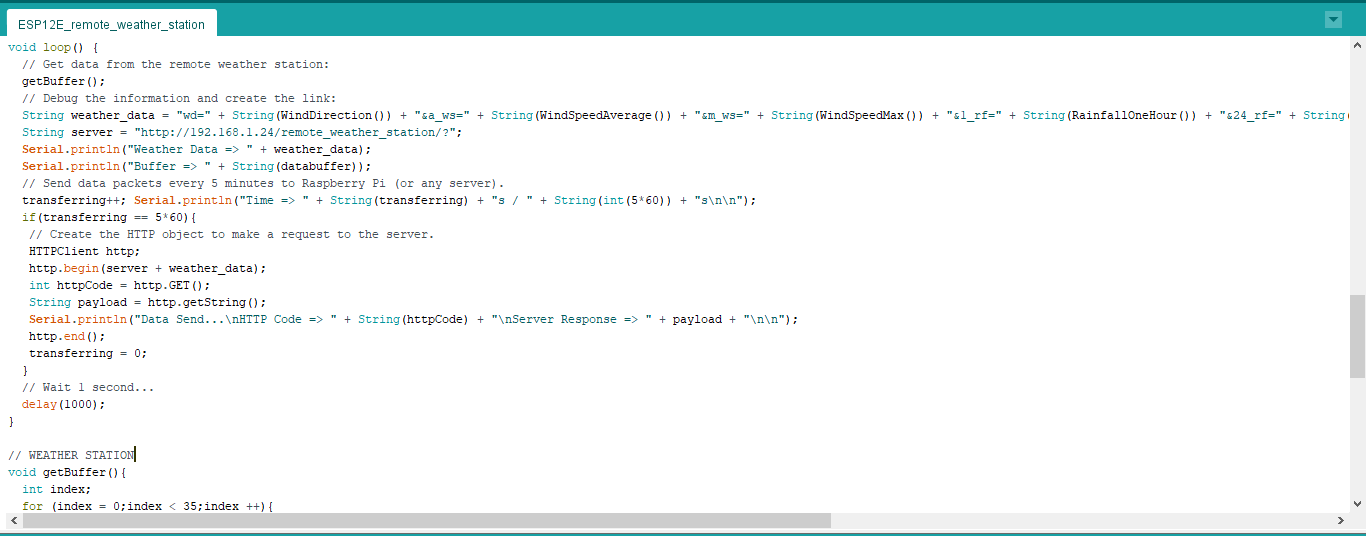
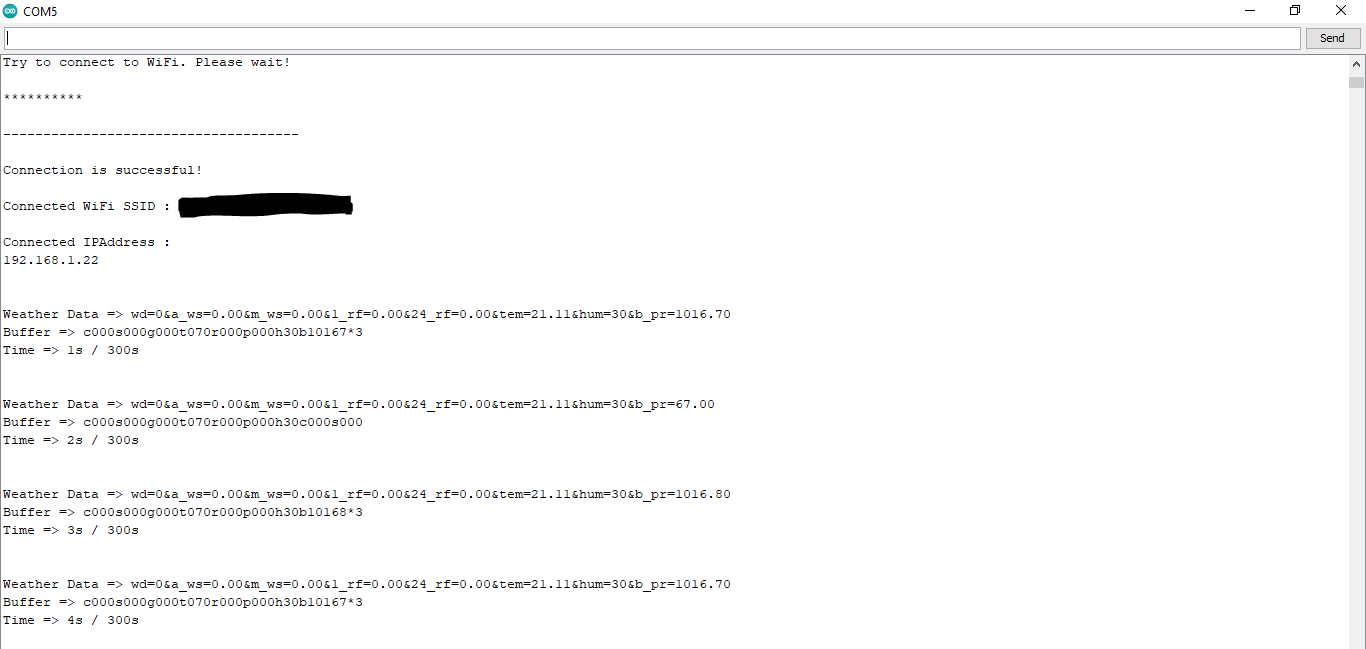
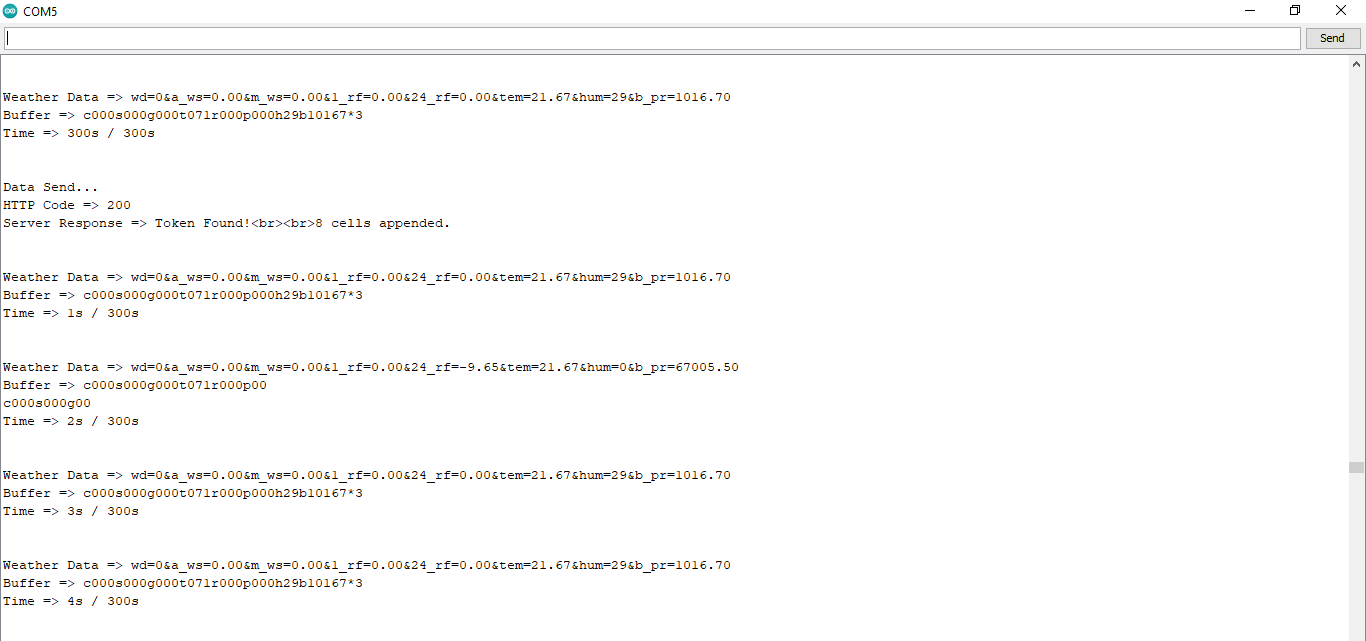
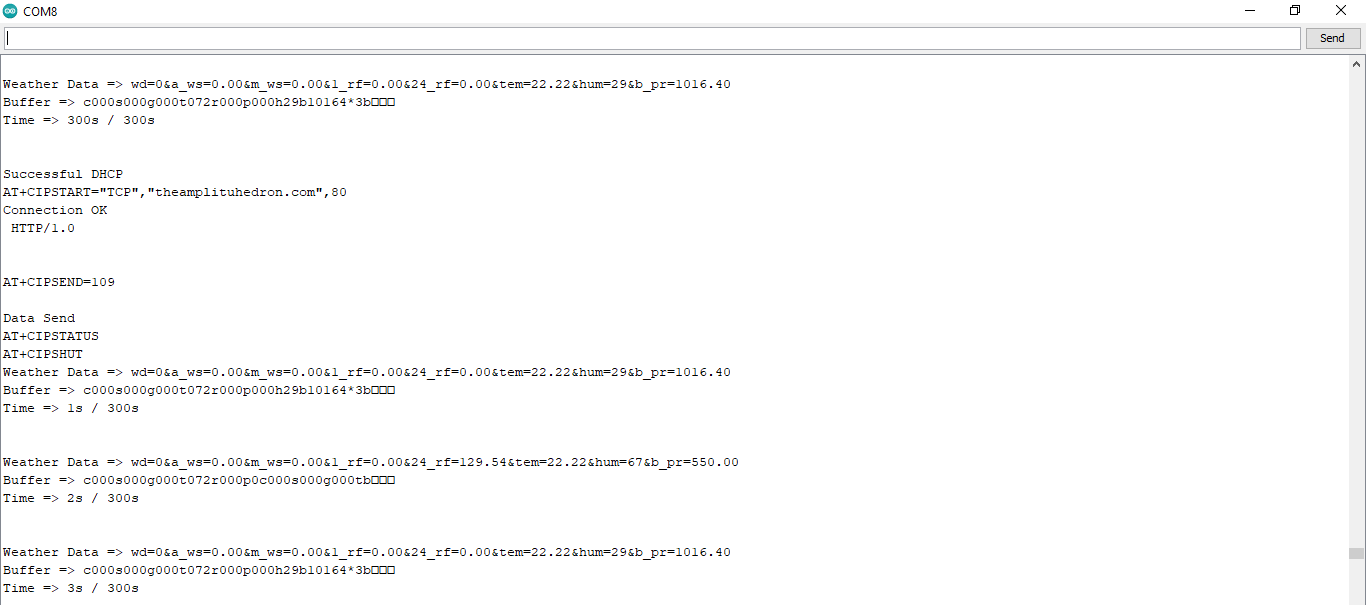
⭐ After uploading the code to the NodeMCU ESP-12E (ESP8266) development board, it displays weather data every second on the serial monitor and sends data packets every five minutes (300 seconds) to the PHP web application.
Connection is successful!

...

Weather Data => wd=0&a_ws=0.00&m_ws=0.00&1_rf=0.00&24_rf=0.00&tem=21.67&hum=29&b_pr=1016.70
Buffer => c000s000g000t071r000p000h29b10167*3
Time => 299s / 300s


Weather Data => wd=0&a_ws=0.00&m_ws=0.00&1_rf=0.00&24_rf=0.00&tem=21.67&hum=29&b_pr=1016.70
Buffer => c000s000g000t071r000p000h29b10167*3
Time => 300s / 300s

...
⭐ Then, it shows the response from the server.
...

Data Send...
HTTP Code => 200
Server Response => Token Found!

8 cells appended.

... 
Step 4.1:Reading and sending weather data with SIM808 (GPRS)
To collect weather data in my backyard, I used a SIM808 shield for Arduino Uno if the distance between the weather station and my router is too far away.
Most of the code is the same and covered in the previous step aside from the parts below.
⭐ Include required libraries and define the sim808 object.
For SIM808 GPS/GPRS/GSM Shield | Download
#include
#include

// Define the sim808.
DFRobot_SIM808 sim808(&Serial);
⭐ Initialize the SIM808 module and continue if it is working accurately.
//******** Initialize sim808 module *************
 while(!sim808.init()) {
 delay(1000);
 Serial.print("Sim808 init error\r\n");
 }
 delay(2000);
 // Continue if the SIM808 Module is working accurately.
 Serial.println("Sim808 init success");
 delay(5000);
⭐ Send data packets every 5 minutes to the server by establishing a TCP connection to make a GET request.
transferring++; Serial.println("Time => " + String(transferring) + "s / " + String(int(5*60)) + "s\n\n");
if(transferring ==5*60){
//*********** Attempt DHCP *******************
while(!sim808.join(F("cmnet"))) {
Serial.println("Sim808 join network error!");
delay(2000);
}
//************ Successful DHCP ****************
delay(5000);
Serial.println("Successful DHCP");
//*********** Establish a TCP connection ************
if(!sim808.connect(TCP,"192.168.1.24", 80)) { // Change it with your server.
Serial.println("Connection Error");
}else{
Serial.println("Connection OK");
}
delay(2000);
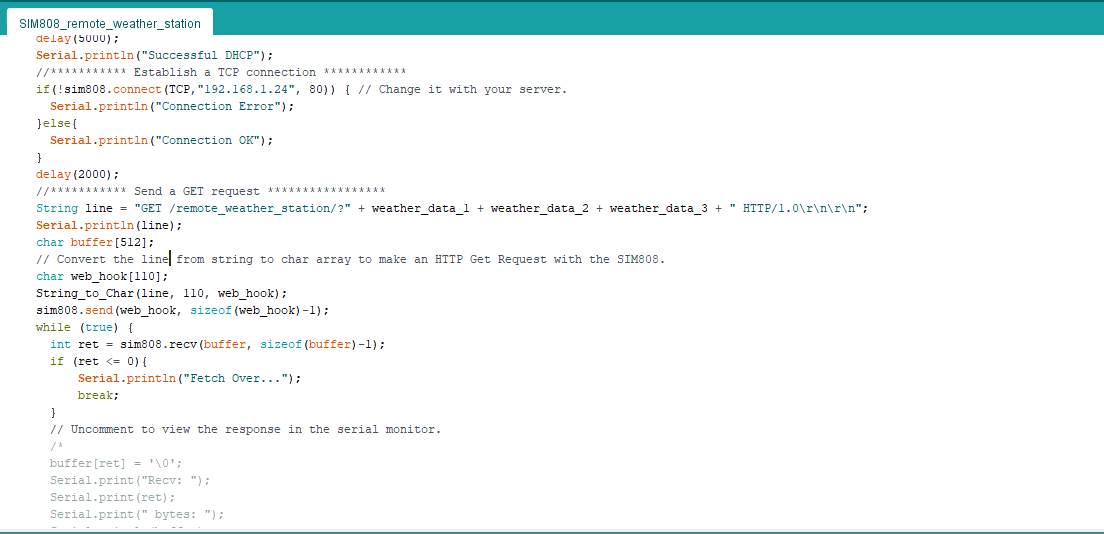
... ⭐ After creating the line string, convert it from string to char array to make an HTTP Get Request with the SIM808.
...

 String line ="GET /remote_weather_station/?" + weather_data_1 + weather_data_2 + weather_data_3 + " HTTP/1.0\r\n\r\n";
 Serial.println(line);
 char buffer[512];
 // Convert the line from string to char array to make an HTTP Get Request with the SIM808.
 char web_hook[110];
 String_to_Char(line, 110, web_hook);
 sim808.send(web_hook, sizeof(web_hook)-1);
 while (true) {
 int ret =sim808.recv(buffer, sizeof(buffer)-1);
 if (ret <=0){
 Serial.println("Fetch Over...");
 break;
 }

... 
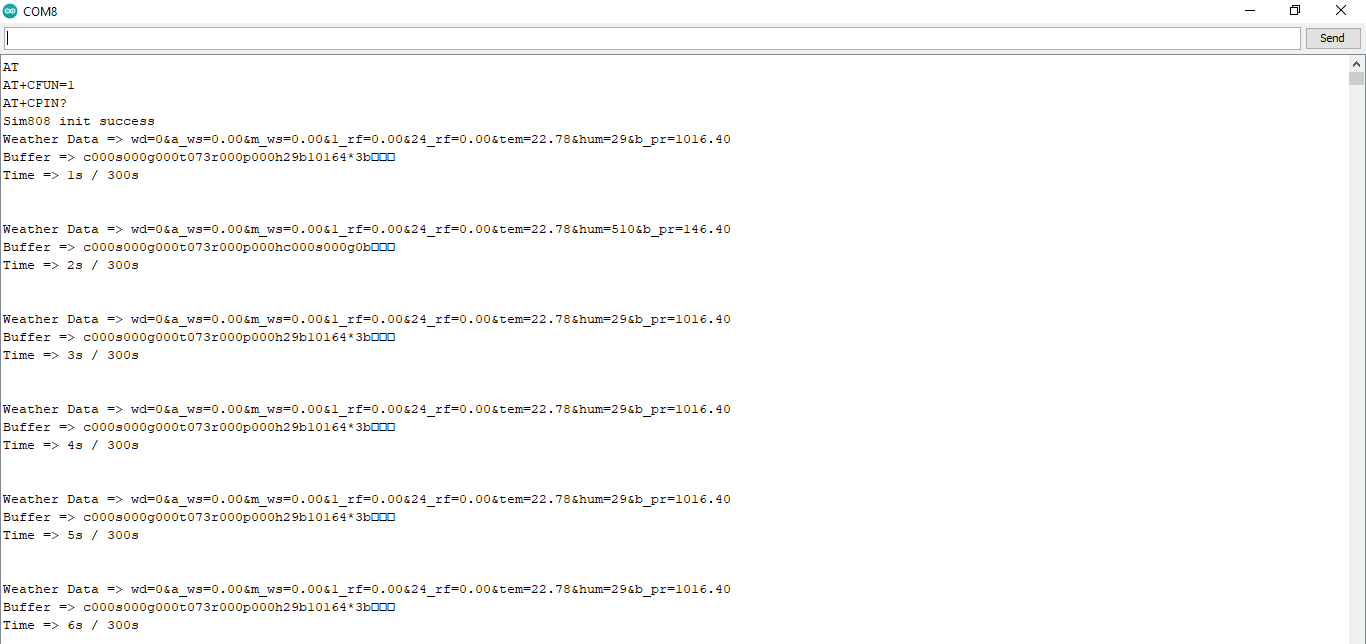
⭐ After uploading the code to the SIM808 shield, it displays weather data every second on the serial monitor and sends data packets every five minutes (300 seconds) to the PHP web application.
Step 4.2:Creating the weather data set for more than three months
After finishing coding, I started to collate weather data on Google Sheets every five minutes for more than three months to build a neural network model and make predictions on the rainfall intensity.
Collected Weather Data:
- Wind Direction (deg)
- Average Wind Speed (m/s)
- Max Wind Speed (m/s)
- One-Hour Rainfall (mm)
- 24-Hours Rainfall (mm)
- Temperature (°C)
- Humidity (%)
- Barometric Pressure (hPa)
Then, I downloaded the spreadsheet as Remote Weather Station.csv , consisting of 32219 rows as my preliminary local weather data set. I am still collating weather data to improve my data set and model :)
Step 5:Building an Artificial Neural Network (ANN) with TensorFlow
When I completed collating my preliminary local weather data set, I started to work on my artificial neural network (ANN) model to make predictions on the rainfall intensity.
I decided to create my neural network model with TensorFlow in Python. So, first of all, I followed the steps below to grasp a better understanding of the weather data:
- Data Visualization
- Data Scaling (Normalizing)
- Data Preprocessing
- Data Splitting
After applying these steps, I decided to use my neural network model to classify different rainfall intensity classes theoretically assigned as labels (outputs) for each input (row). I created my classes according to the rate of precipitation, which depends on the considered time.
The following categories are used to classify rainfall intensity by the rate of precipitation (rainfall):
- Light rain — when the precipitation rate is <2.5 mm per hour
- Moderate rain — when the precipitation rate is between 2.5 mm and 7.6 mm per hour
- Heavy rain — when the precipitation rate is between 7.6 mm and 50 mm per hour
- Violent rain — when the precipitation rate is> 50 mm per hour
According to the precipitation (rainfall) rates, I preprocessed the weather data to assign one of these five classes for each input as its label:
- 0 (None)
- 1 (Light Rain)
- 2 (Moderate Rain)
- 3 (Heavy Rain)
- 4 (Violent Rain)
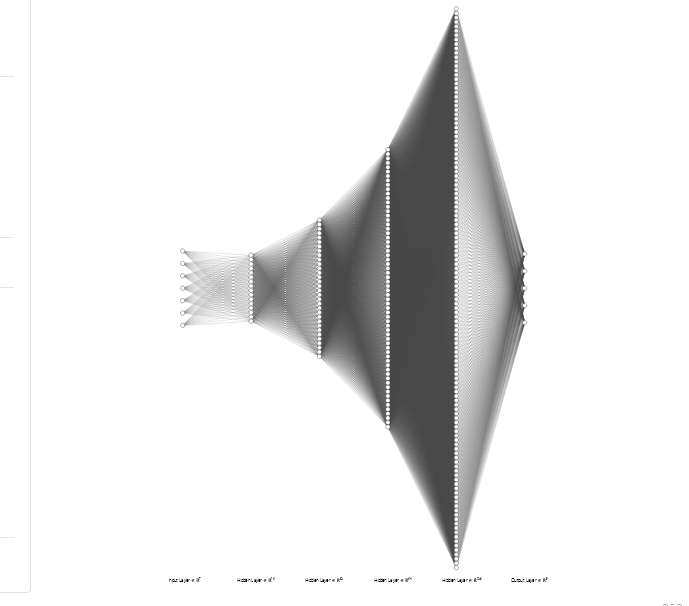
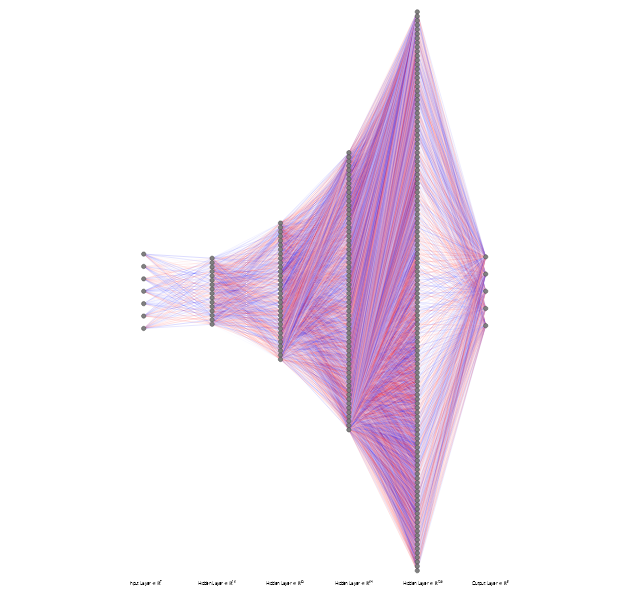
After scaling (normalizing) and preprocessing the weather data, I elicited seven input variables and one label for each reading, classified with the five mentioned classes. Then, I built an artificial neural network model with TensorFlow to obtain the best possible results and predictions with my preliminary data set.
Layers:
- 7 [Input]
- 16 [Hidden]
- 32 [Hidden]
- 64 [Hidden]
- 128 [Hidden]
- 5 [Output]
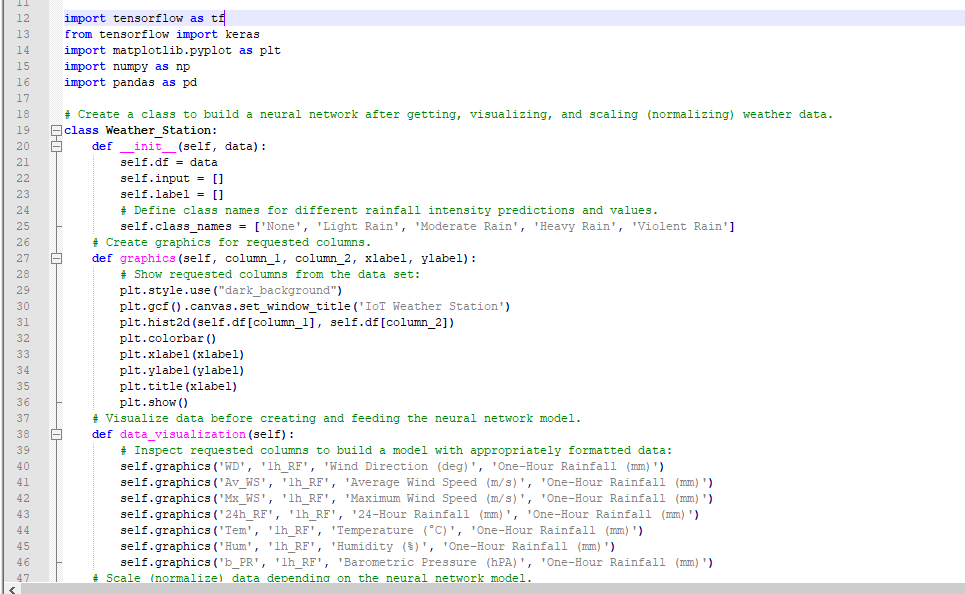
To execute all steps above, I created a class named Weather_Station in Python after including the required libraries:
import tensorflow as tf
from tensorflow import keras
import matplotlib.pyplot as plt
import numpy as np
import pandas as pd
Subsequently, I will discuss coding in Python for each step I mentioned above.
Also, you can download IoT_weather_station_neural_network.py to inspect coding.
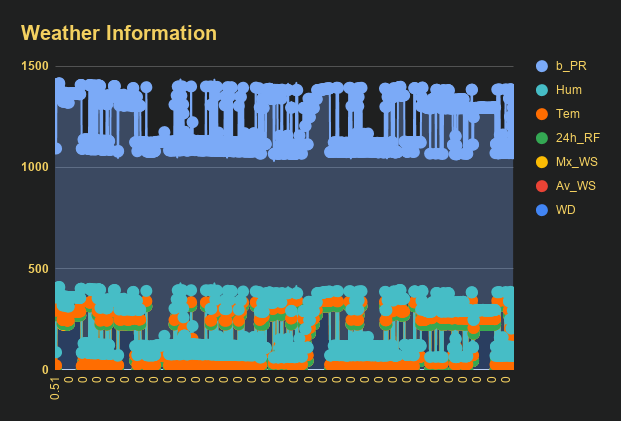
Step 5.1:Visualizing and scaling (normalizing) the weather data
Before diving in to build a model, it is important to understand the weather data to pass the model appropriately formatted data.
So, in this step, I will show you how to visualize weather data and scale (normalize) in Python.
⭐ First of all, read the weather data from Remote Weather Station.csv .
csv_path ="E:\PYTHON\Remote Weather Station.csv"
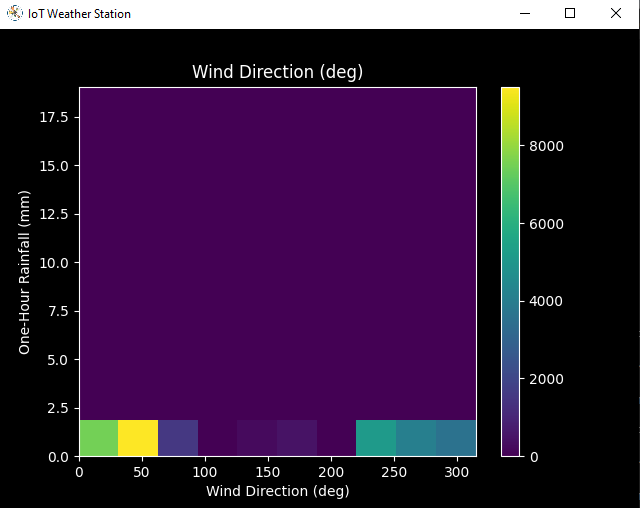
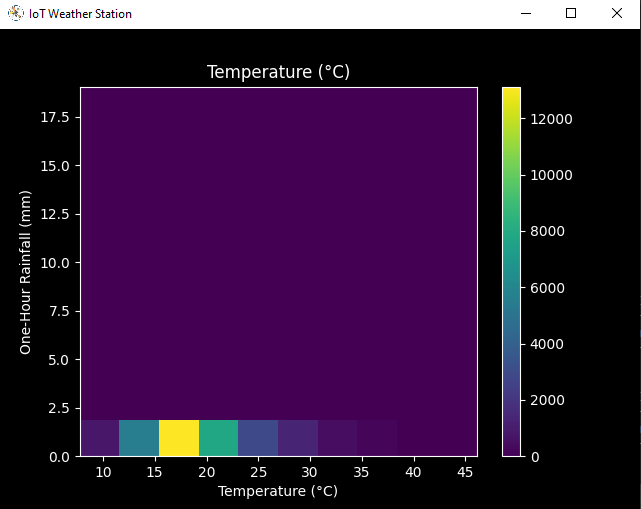
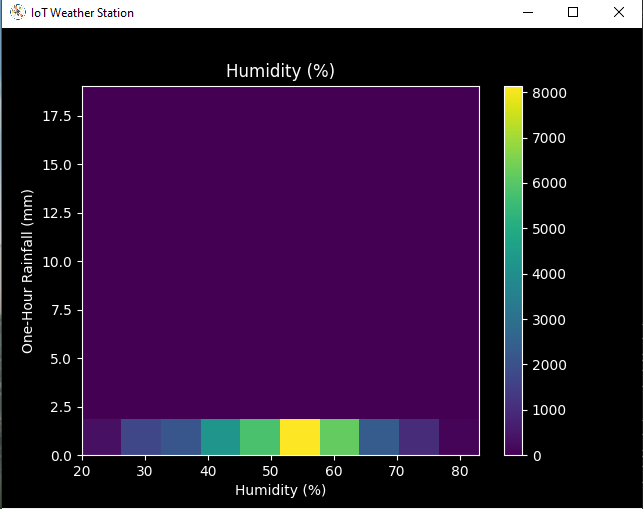
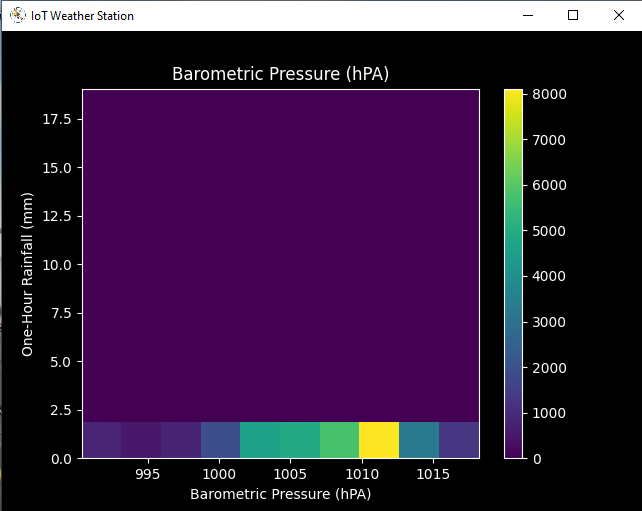
df =pd.read_csv(csv_path) ⭐ In the graphics() function, visualize the requested columns from the weather data set by using the Matplotlib library.
def graphics(self, column_1, column_2, xlabel, ylabel):
 # Show requested columns from the data set:
 plt.style.use("dark_background")
 plt.gcf().canvas.set_window_title('IoT Weather Station')
 plt.hist2d(self.df[column_1], self.df[column_2])
 plt.colorbar()
 plt.xlabel(xlabel)
 plt.ylabel(ylabel)
 plt.title(xlabel)
 plt.show()
⭐ In the data_visualization() function, inspect all columns before scaling weather data to build a model with appropriately formatted data.
def data_visualization(self):
 # Inspect requested columns to build a model with appropriately formatted data:
 self.graphics('WD', '1h_RF', 'Wind Direction (deg)', 'One-Hour Rainfall (mm)')
 self.graphics('Av_WS', '1h_RF', 'Average Wind Speed (m/s)', 'One-Hour Rainfall (mm)')
 self.graphics('Mx_WS', '1h_RF', 'Maximum Wind Speed (m/s)', 'One-Hour Rainfall (mm)')
 self.graphics('24h_RF', '1h_RF', '24-Hour Rainfall (mm)', 'One-Hour Rainfall (mm)')
 self.graphics('Tem', '1h_RF', 'Temperature (°C)', 'One-Hour Rainfall (mm)')
 self.graphics('Hum', '1h_RF', 'Humidity (%)', 'One-Hour Rainfall (mm)')
 self.graphics('b_PR', '1h_RF', 'Barometric Pressure (hPA)', 'One-Hour Rainfall (mm)')
After visualizing weather data, I scaled (normalized) each column to format it properly.
Normally, each row (reading) looked like this before scaling:
- 315, 0.45, 0, 0.51, 0.51, 22.78, 65, 1005.5
⭐ In the scale_data() função:
⭐ The wind direction in units of degrees and angles do not make good model inputs. 360° and 0° should be close to each other and wrap around smoothly. The direction should not matter if the wind is not blowing. Thus, convert the wind direction and velocity columns to a wind vector to interpret them easily with a neural network model.
def scale_data(self):
 # Wind Direction and Speed:
 wv =self.df.pop('Av_WS')
 max_wv =self.df.pop('Mx_WS')
 # Convert to radians.
 wd_rad =self.df.pop('WD')*np.pi / 180
 # Calculate the wind x and y components.
 self.df['scaled_WX'] =wv*np.cos(wd_rad)
 self.df['scaled_WY'] =wv*np.sin(wd_rad)
 # Calculate the max wind x and y components.
 self.df['scaled_max_WX'] =max_wv*np.cos(wd_rad)
 self.df['scaled_max_WY'] =max_wv*np.sin(wd_rad)

 ...
⭐ For the remaining columns except for 1h_RF , divide them into average reading values to scale (normalize) and format.
...

 # Temperature:
 tem =self.df.pop('Tem')
 self.df['scaled_Tem'] =tem / 25
 # Humidity:
 hum =self.df.pop('Hum')
 self.df['scaled_Hum'] =hum / 70
 # Barometric Pressure:
 bPR =self.df.pop('b_PR')
 self.df["scaled_bPR"] =bPR / 1013
 # 24 Hour Rainfall (Approx.)
 rain_24 =self.df.pop('24h_RF')
 self.df['scaled_24h_RF'] =rain_24 / 24
After completing scaling (normalizing), I extracted these new columns from the weather data set:
- scaled_WX
- scaled_WY
- scaled_max_WX
- scaled_max_WY
- scaled_Tem
- scaled_Hum
- scaled_bPR
- scaled_24h_RF
Step 5.2:Training the model (ANN) on the rainfall intensity classes
Before building and training a neural network model in TensorFlow, I needed to create the input array and the label array by preprocessing the scaled and normalized weather data set.
⭐ In the create_input_and_label() função:
⭐ Firstly, append each input element as a NumPy array to the input array and convert it to a NumPy array by using the asarray() função.
⭐ Each input element includes seven variables [shape=(7, )]:
- [scaled_WX, scaled_WY, scaled_max_WX, scaled_max_WY, scaled_Tem, scaled_Hum, scaled_bPR]
def create_input_and_label(self):
 n =len(self.df)
 # Create the input array using the scaled variables:
 for i in range(n):
 self.input.append(np.array([self.df['scaled_WX'][i], self.df['scaled_WY'][i], self.df['scaled_max_WX'][i], self.df['scaled_max_WY'][i], self.df['scaled_Tem'][i], self.df['scaled_Hum'][i], self.df['scaled_bPR'][i]]))
 self.input =np.asarray(self.input)

 ...
⭐ Then, evaluate the approximate rainfall (precipitation) rate for each reading (row).
approx_RF_rate =(1h_RF + scaled_24h_RF) * 100
⭐ According to the rainfall rate, assign a class [0 - 4] for each input element and append them to the label array.
...
for i in range(n):
_class =0
# Evaluate the approximate rainfall rate:
approx_RF_rate =(self.df['1h_RF'][i] + self.df['scaled_24h_RF'][i]) * 100
# As labels, assign classes of rainfall intensity according to the approximate rainfall rate (mm):
if approx_RF_rate ==0:
_class =0
elif approx_RF_rate <2.5:
_class =1
elif 2.5
elif 7.6
else:
_class =4
self.label.append(_class)
self.label =np.asarray(self.label) After preprocessing the scaled weather data to create input and label arrays, I split them as training (60%) and test (40%) data sets:
def split_data(self):
n =len(self.df)
# (60%, 40%) - (training, test)
self.train_input =self.input[0:int(n*0.6)]
self.test_input =self.input[int(n*0.6):]
self.train_label =self.label[0:int(n*0.6)]
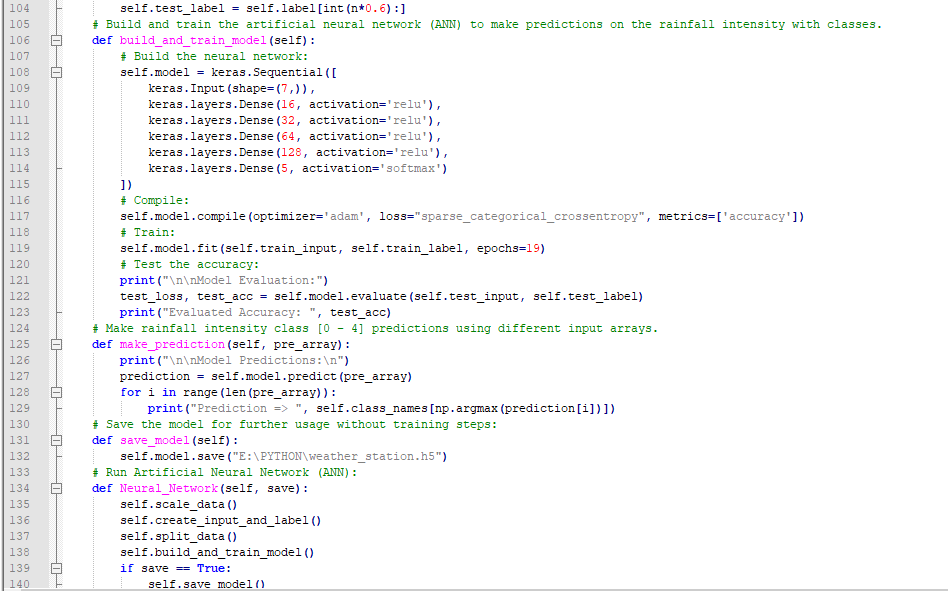
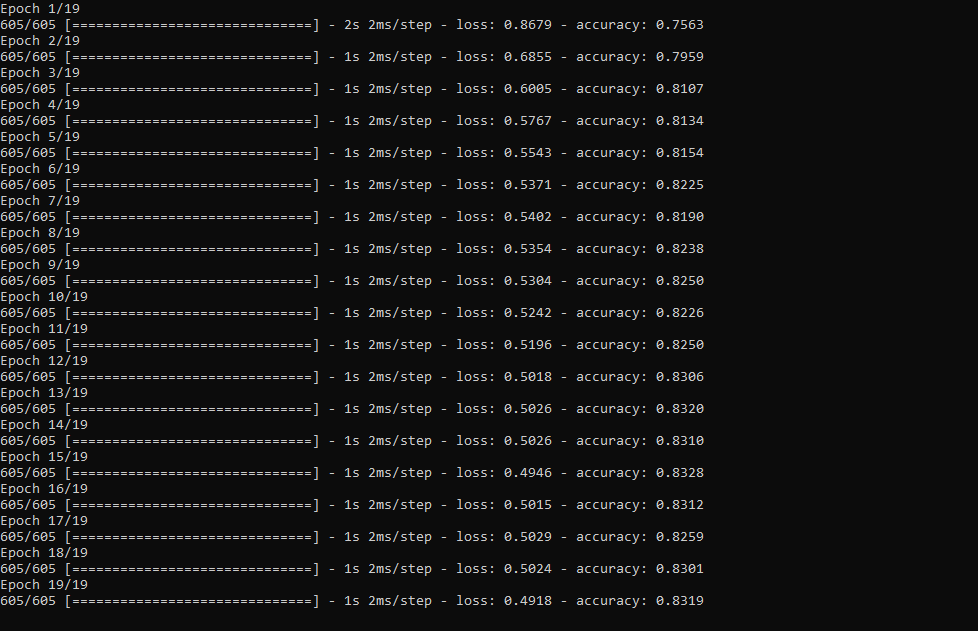
self.test_label =self.label[int(n*0.6):] Then, I built my artificial neural network (ANN) model by using Keras and trained it with the training data set for nineteen epochs.
You can inspect these tutorials to learn about activation functions, loss functions, epochs, etc.
def build_and_train_model(self):
 # Build the neural network:
 self.model =keras.Sequential([
 keras.Input(shape=(7,)),
 keras.layers.Dense(16, activation='relu'),
 keras.layers.Dense(32, activation='relu'),
 keras.layers.Dense(64, activation='relu'),
 keras.layers.Dense(128, activation='relu'),
 keras.layers.Dense(5, activation='softmax')
 ])
 # Compile:
 self.model.compile(optimizer='adam', loss="sparse_categorical_crossentropy", metrics=['accuracy'])
 # Train:
 self.model.fit(self.train_input, self.train_label, epochs=19)

 ...
After training with the preliminary training data set, the accuracy of the model is between 0.83 and 0.85 .
Step 5.3:Evaluating the model and making predictions on the rainfall intensity
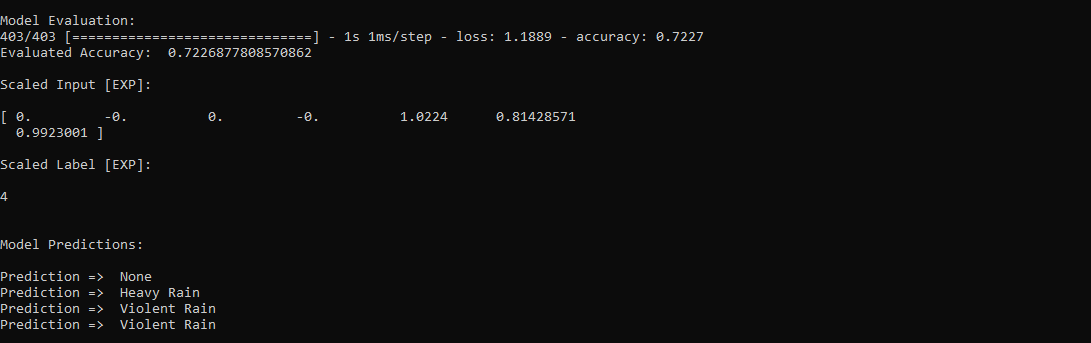
After building and training my artificial neural network model, I tested its accuracy by using the preliminary testing data set.
For now, the evaluated accuracy of the model is between 0.72 and 0.73 due to inadequate testing data set overfitting the model. However, I am still collecting weather data to improve the model accuracy.
...

 # Test the accuracy:
 print("\n\nModel Evaluation:")
 test_loss, test_acc =self.model.evaluate(self.test_input, self.test_label)
 print("Evaluated Accuracy:", test_acc)
Then, I used my neural network model to make predictions on the rainfall intensity with a given prediction array consisting of readings from the weather station after the training of the model. As a starting point, the model works fine :)
The model predicts possibilities of labels for each input element as an array of 5 numbers. They represent the model's "confidence" that the given input element corresponds to each of the five different classes of rainfall intensity [0 - 4].
⭐ In the make_prediction() function, make a prediction for each input element in a given array and get the most accurate label [0 - 4] by using the argmax() function to display its class name.
def make_prediction(self, pre_array):
 print("\n\nModel Predictions:\n")
 prediction =self.model.predict(pre_array)
 for i in range(len(pre_array)):
 print("Prediction => ", self.class_names[np.argmax(prediction[i])])
Prediction Inputs:
- [0, 0, 0.31819805, 0.31819805, 0.6988, 0.81498571, 0.99349753]
- [0, -0, 0, -0, 0.8444, 1, 0.96835143]
- [0, 0, 0.45, 0, 0.87577, 0.95857143, 1.00128332]
- [-0, -0, -0, -0, 0.8224, 1.05714286, 0.99279368]
Prediction Outputs:
- 0 [None]
- 3 [Heavy Rain]
- 4 [Violent Rain]
- 4 [Violent Rain]

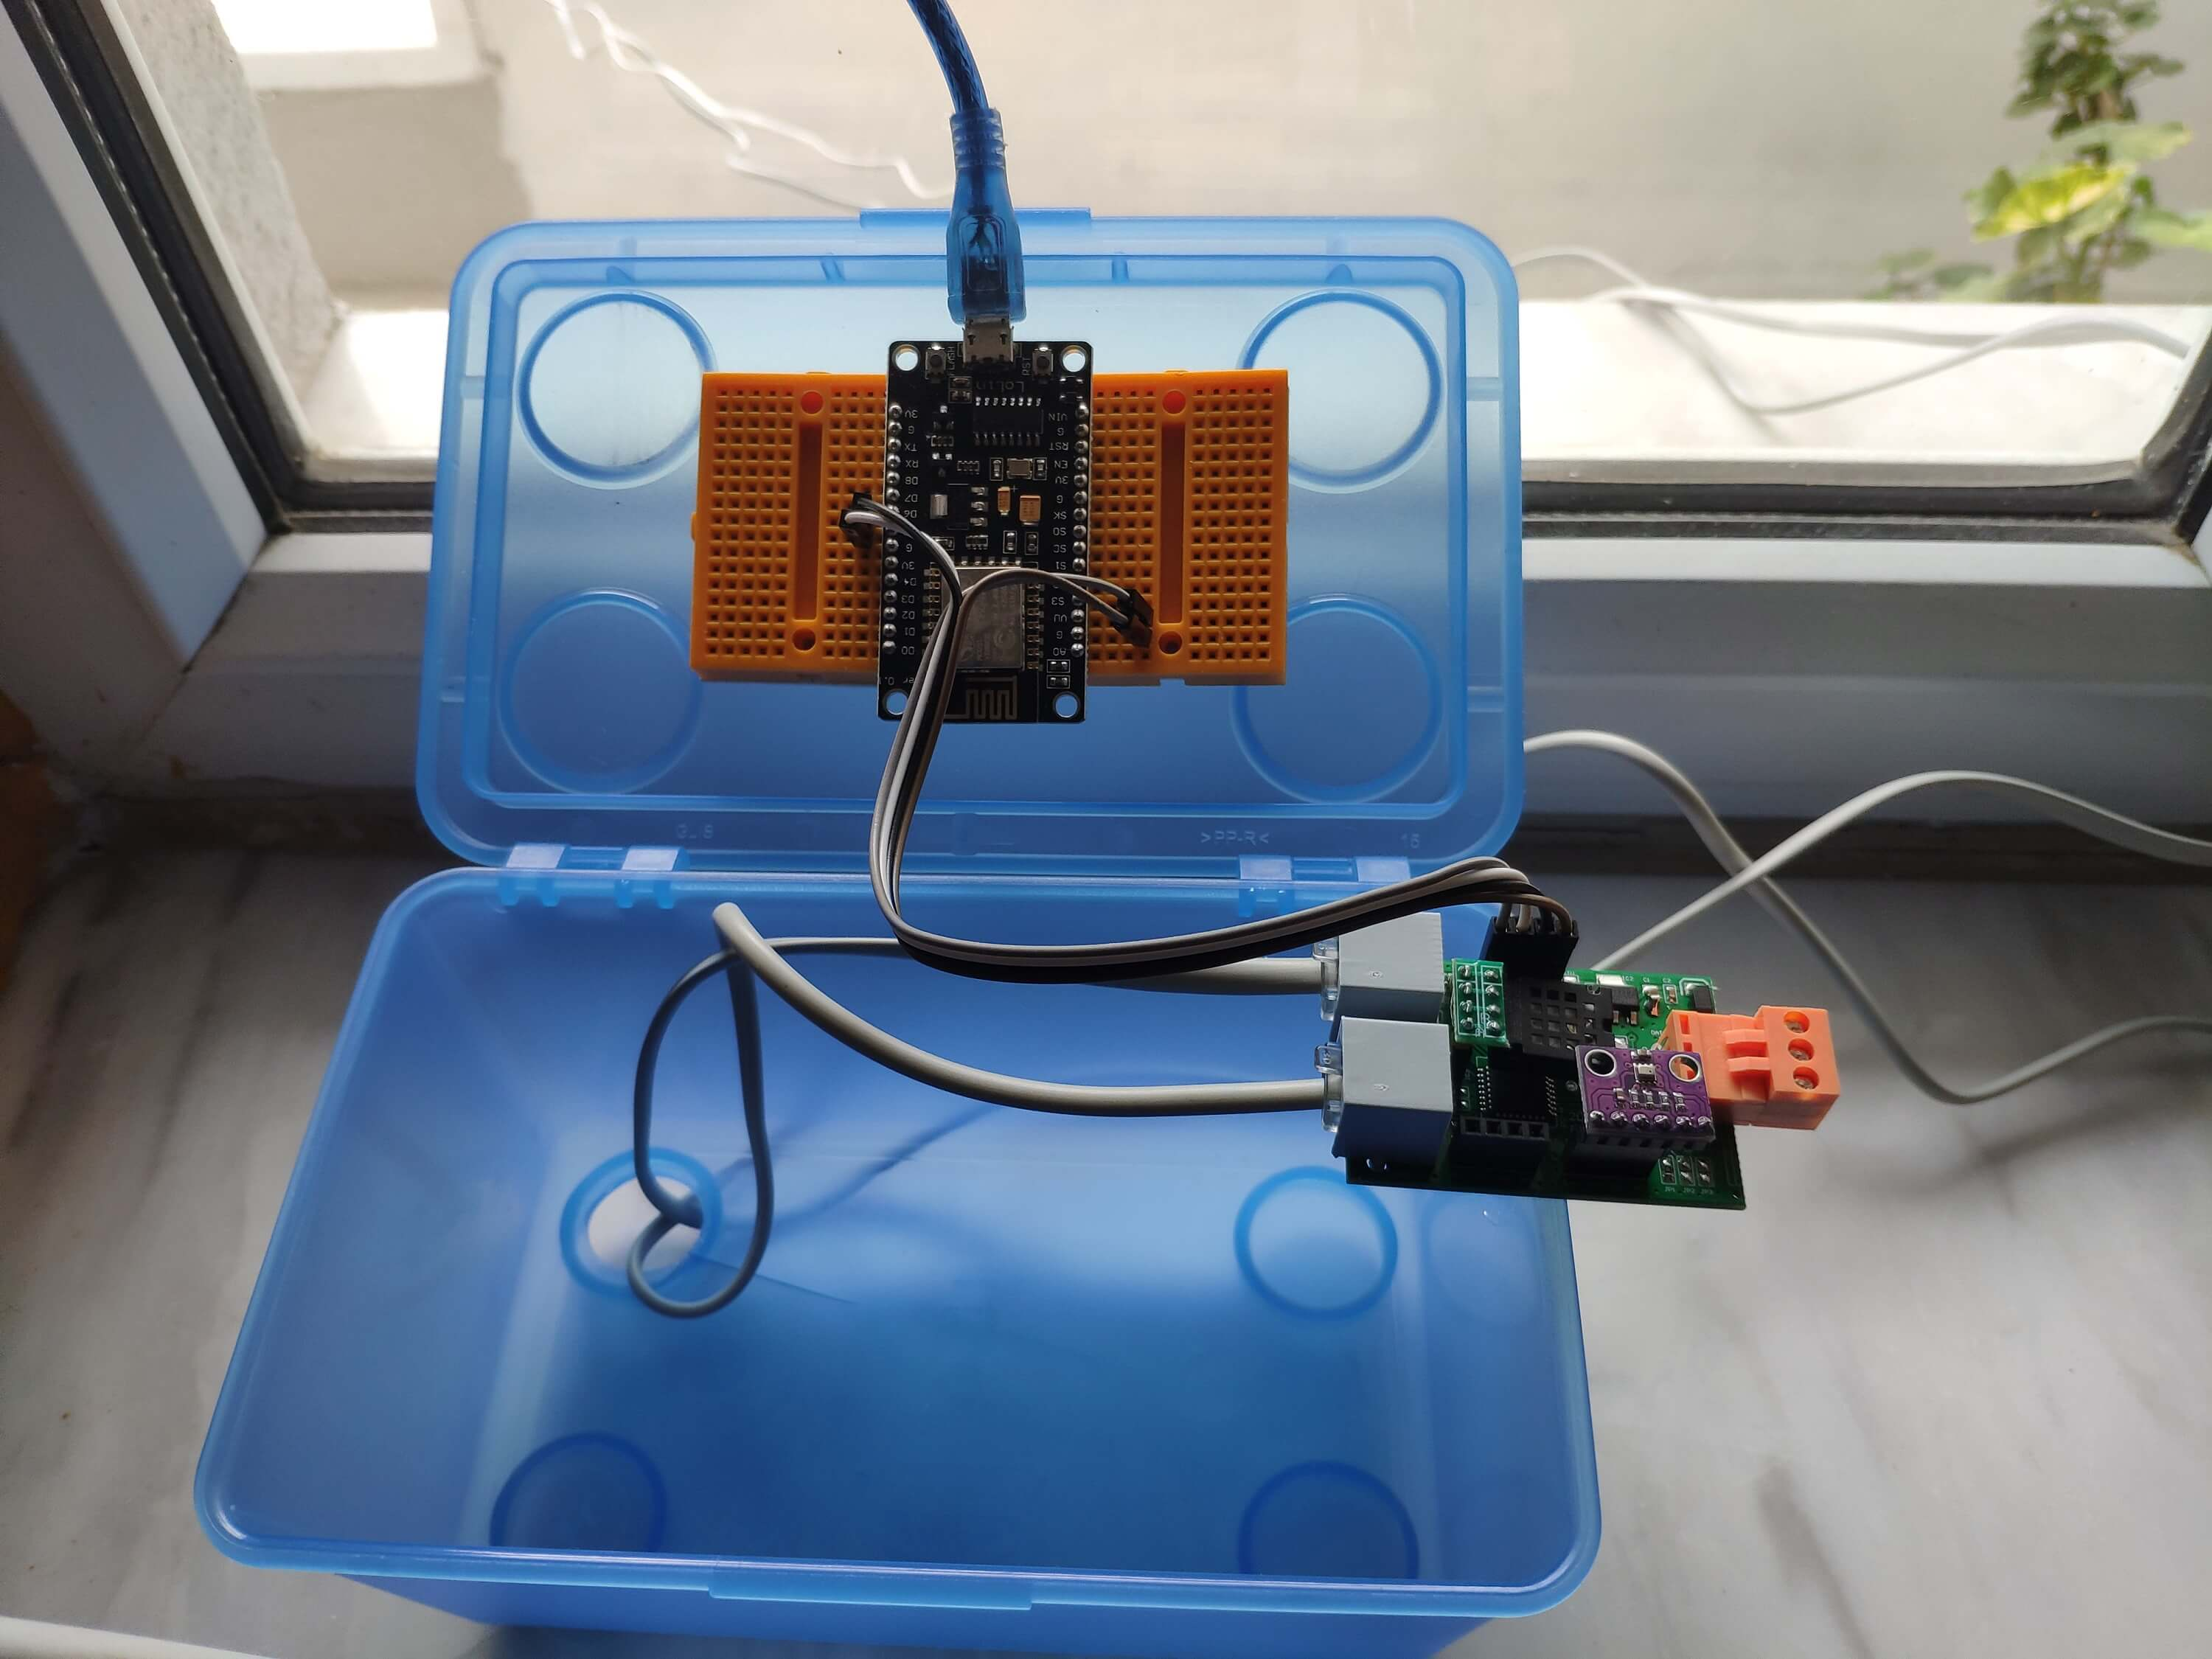
Connections and Adjustments (ESP8266)
// Connections
// NodeMCU ESP-12E (ESP8266) :
// Weather Station
// VV --------------------------- 5V
// D5 --------------------------- RX
// D6 --------------------------- TX
// G --------------------------- GND
I connected the sensor (converter) board to the NodeMCU ESP-12E (ESP8266) development board and fastened them to a plastic box while collecting weather data at my balcony.
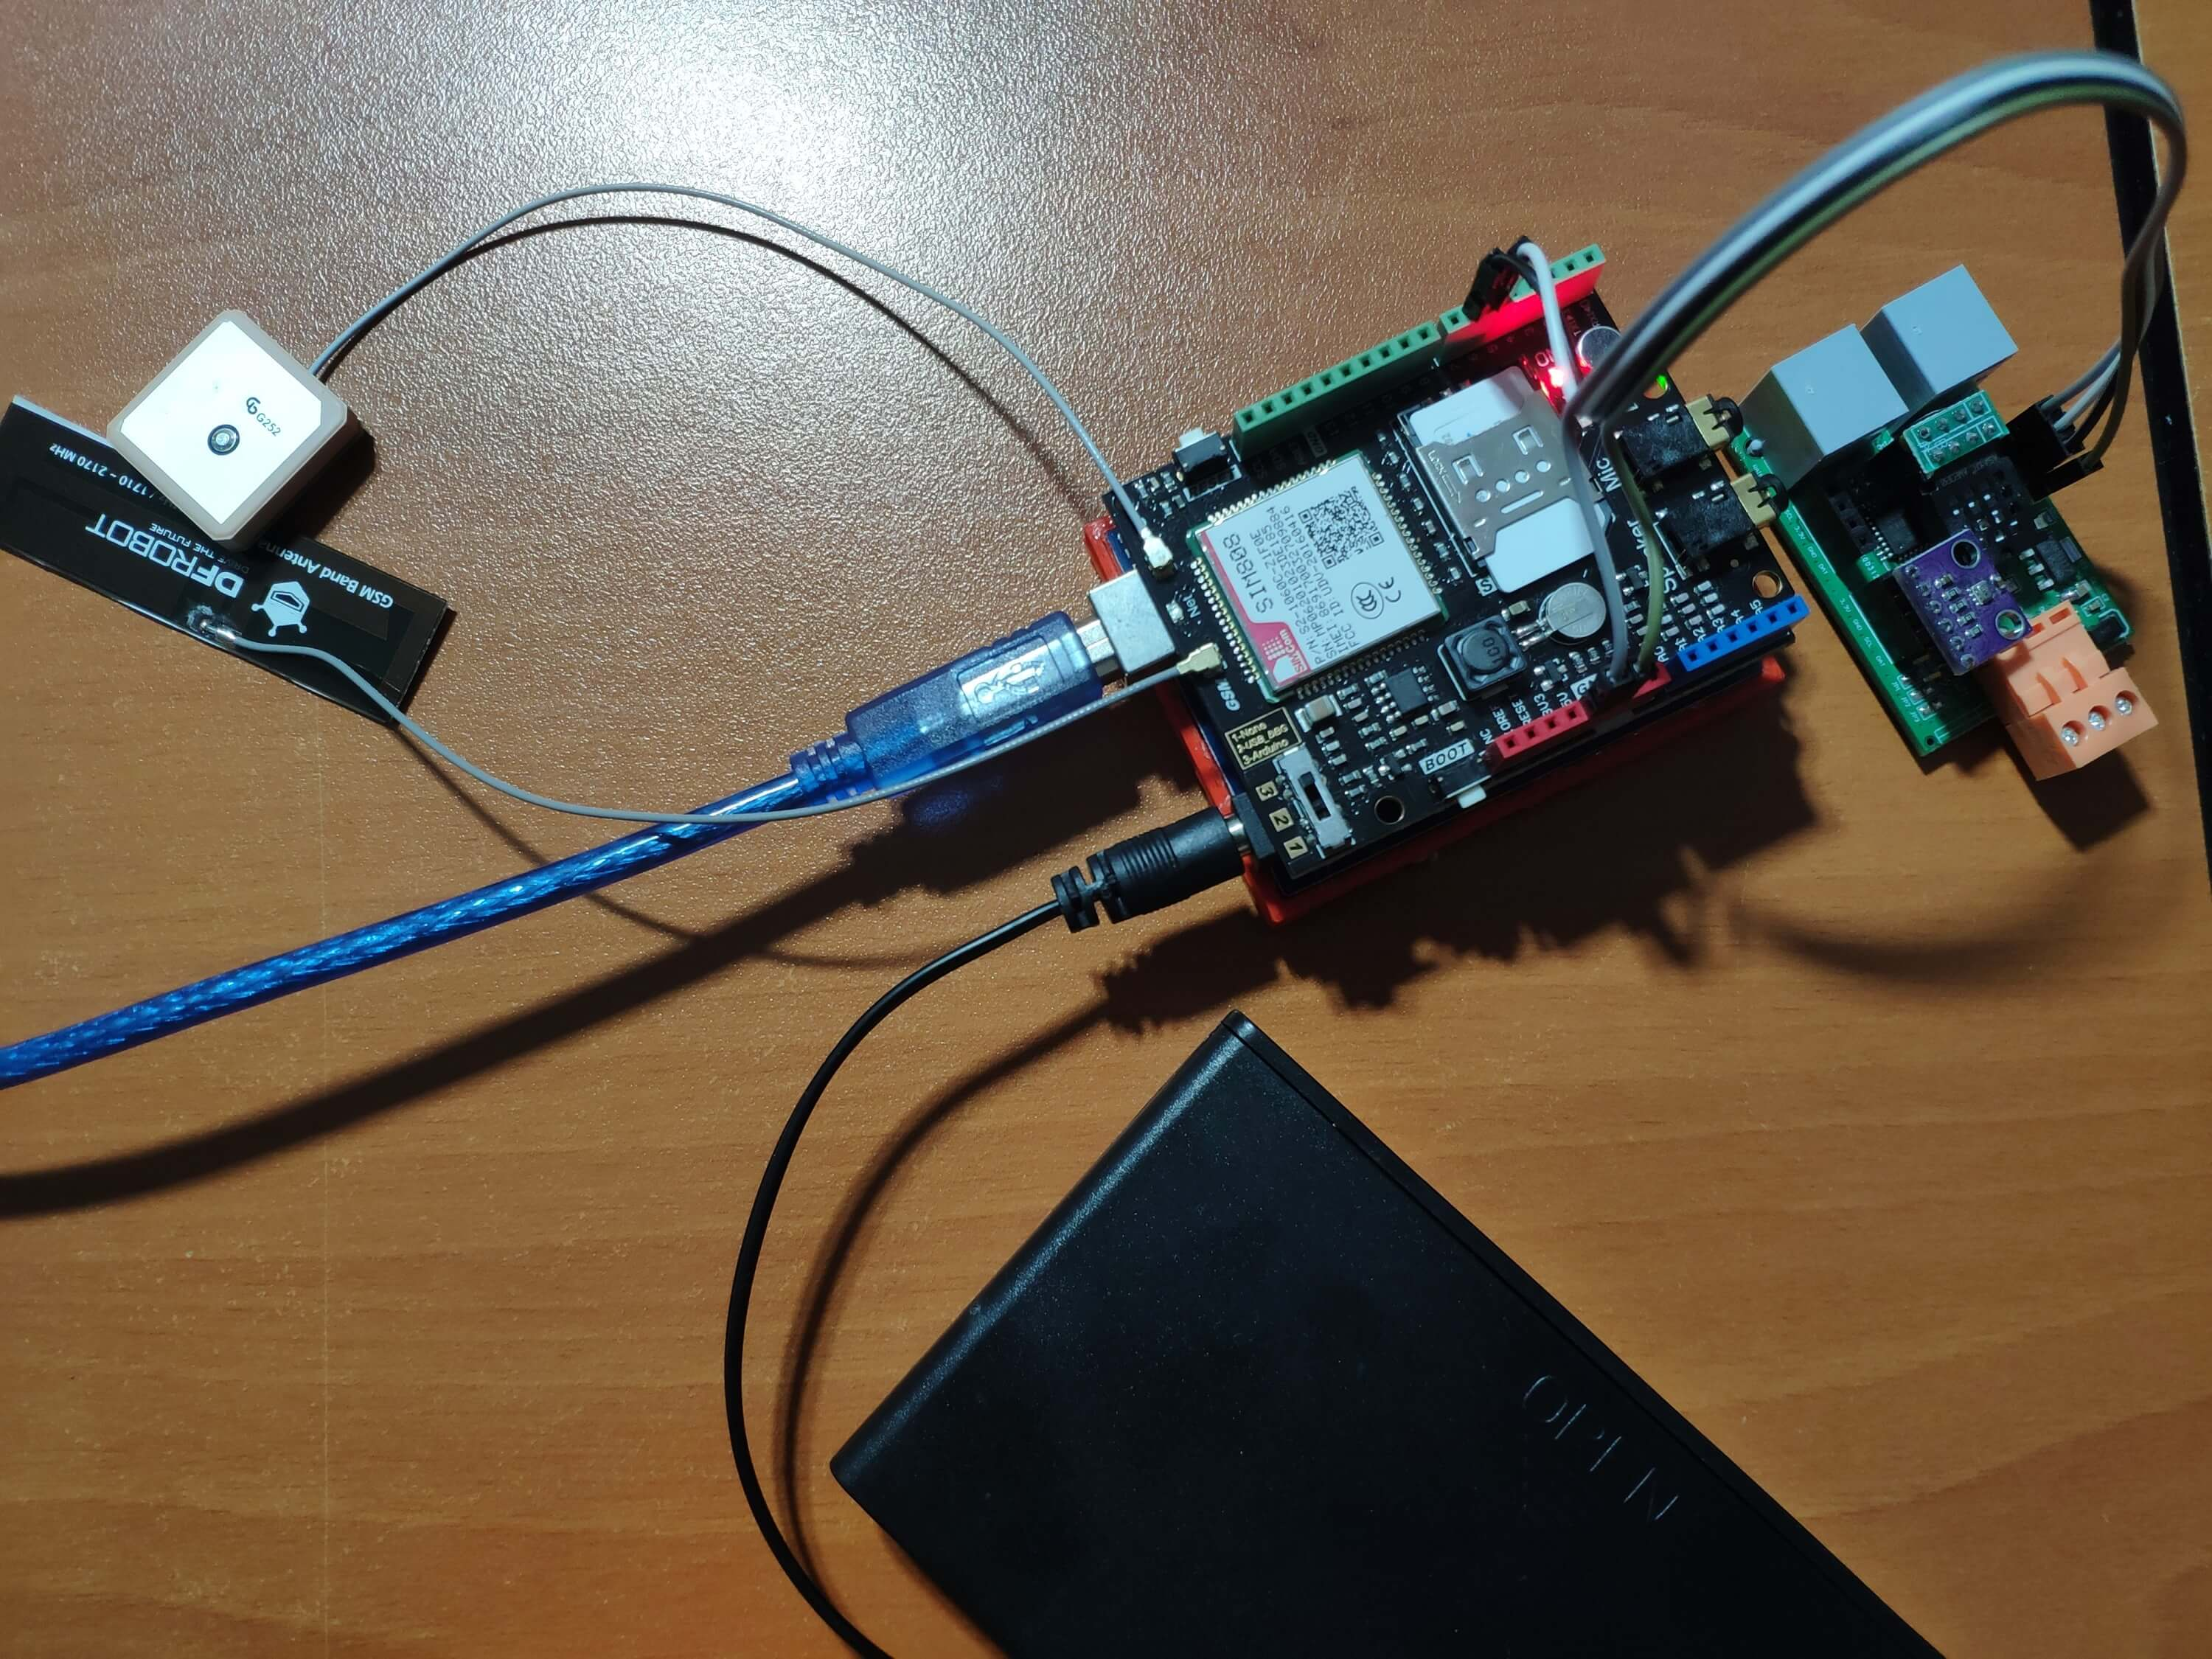
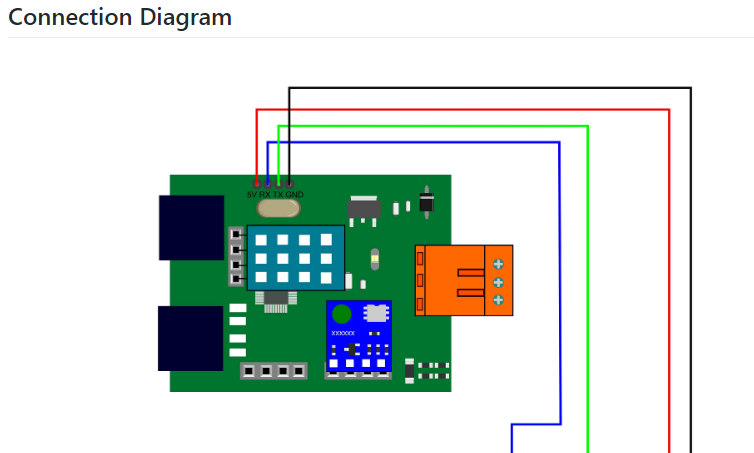
Connections and Adjustments (SIM808)
// Connections
// Arduino Uno:
// SIM808 GPS/GPRS/GSM Shield For Arduino
// D0 --------------------------- RX
// D1 --------------------------- TX
// D12 --------------------------- POWER
// Weather Station
// 5V --------------------------- 5V
// D5 --------------------------- RX
// D6 --------------------------- TX
// GND --------------------------- GND
⭐ Note:D0, D1, D12 pins are occupied by the SIM808 GPS/GPRS/GSM Shield.
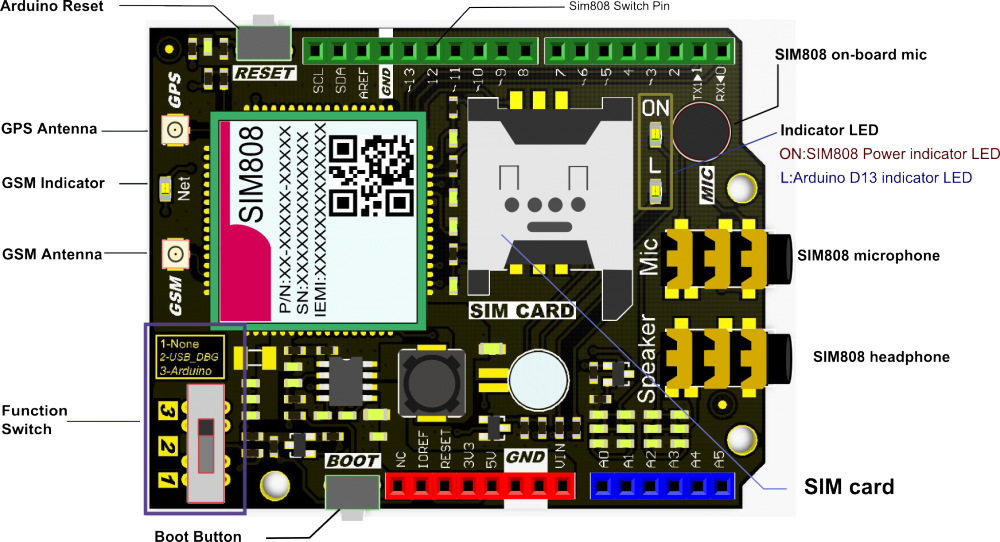
⭐ Connect an external battery (7-23V) for the SIM808 module to work properly.
⭐ Attach the GPS antenna and the GSM antenna to the SIM808 shield.
⭐ Insert a SIM card into the SIM slot on the SIM808 shield.
⭐ Before uploading the code, set the function switch on the shield to None (1).
⭐ Upload the code.
⭐ Then, set the function switch to Arduino (3).
⭐ Press the Boot button on the shield until seeing the Net indicator LED flashing every 1 second and wait for the SIM card to register the network - the Net indicator LED will slowly flash every 3 seconds.
⭐ Click here to get more information about the SIM808 GSM/GPS/GPRS Shield.
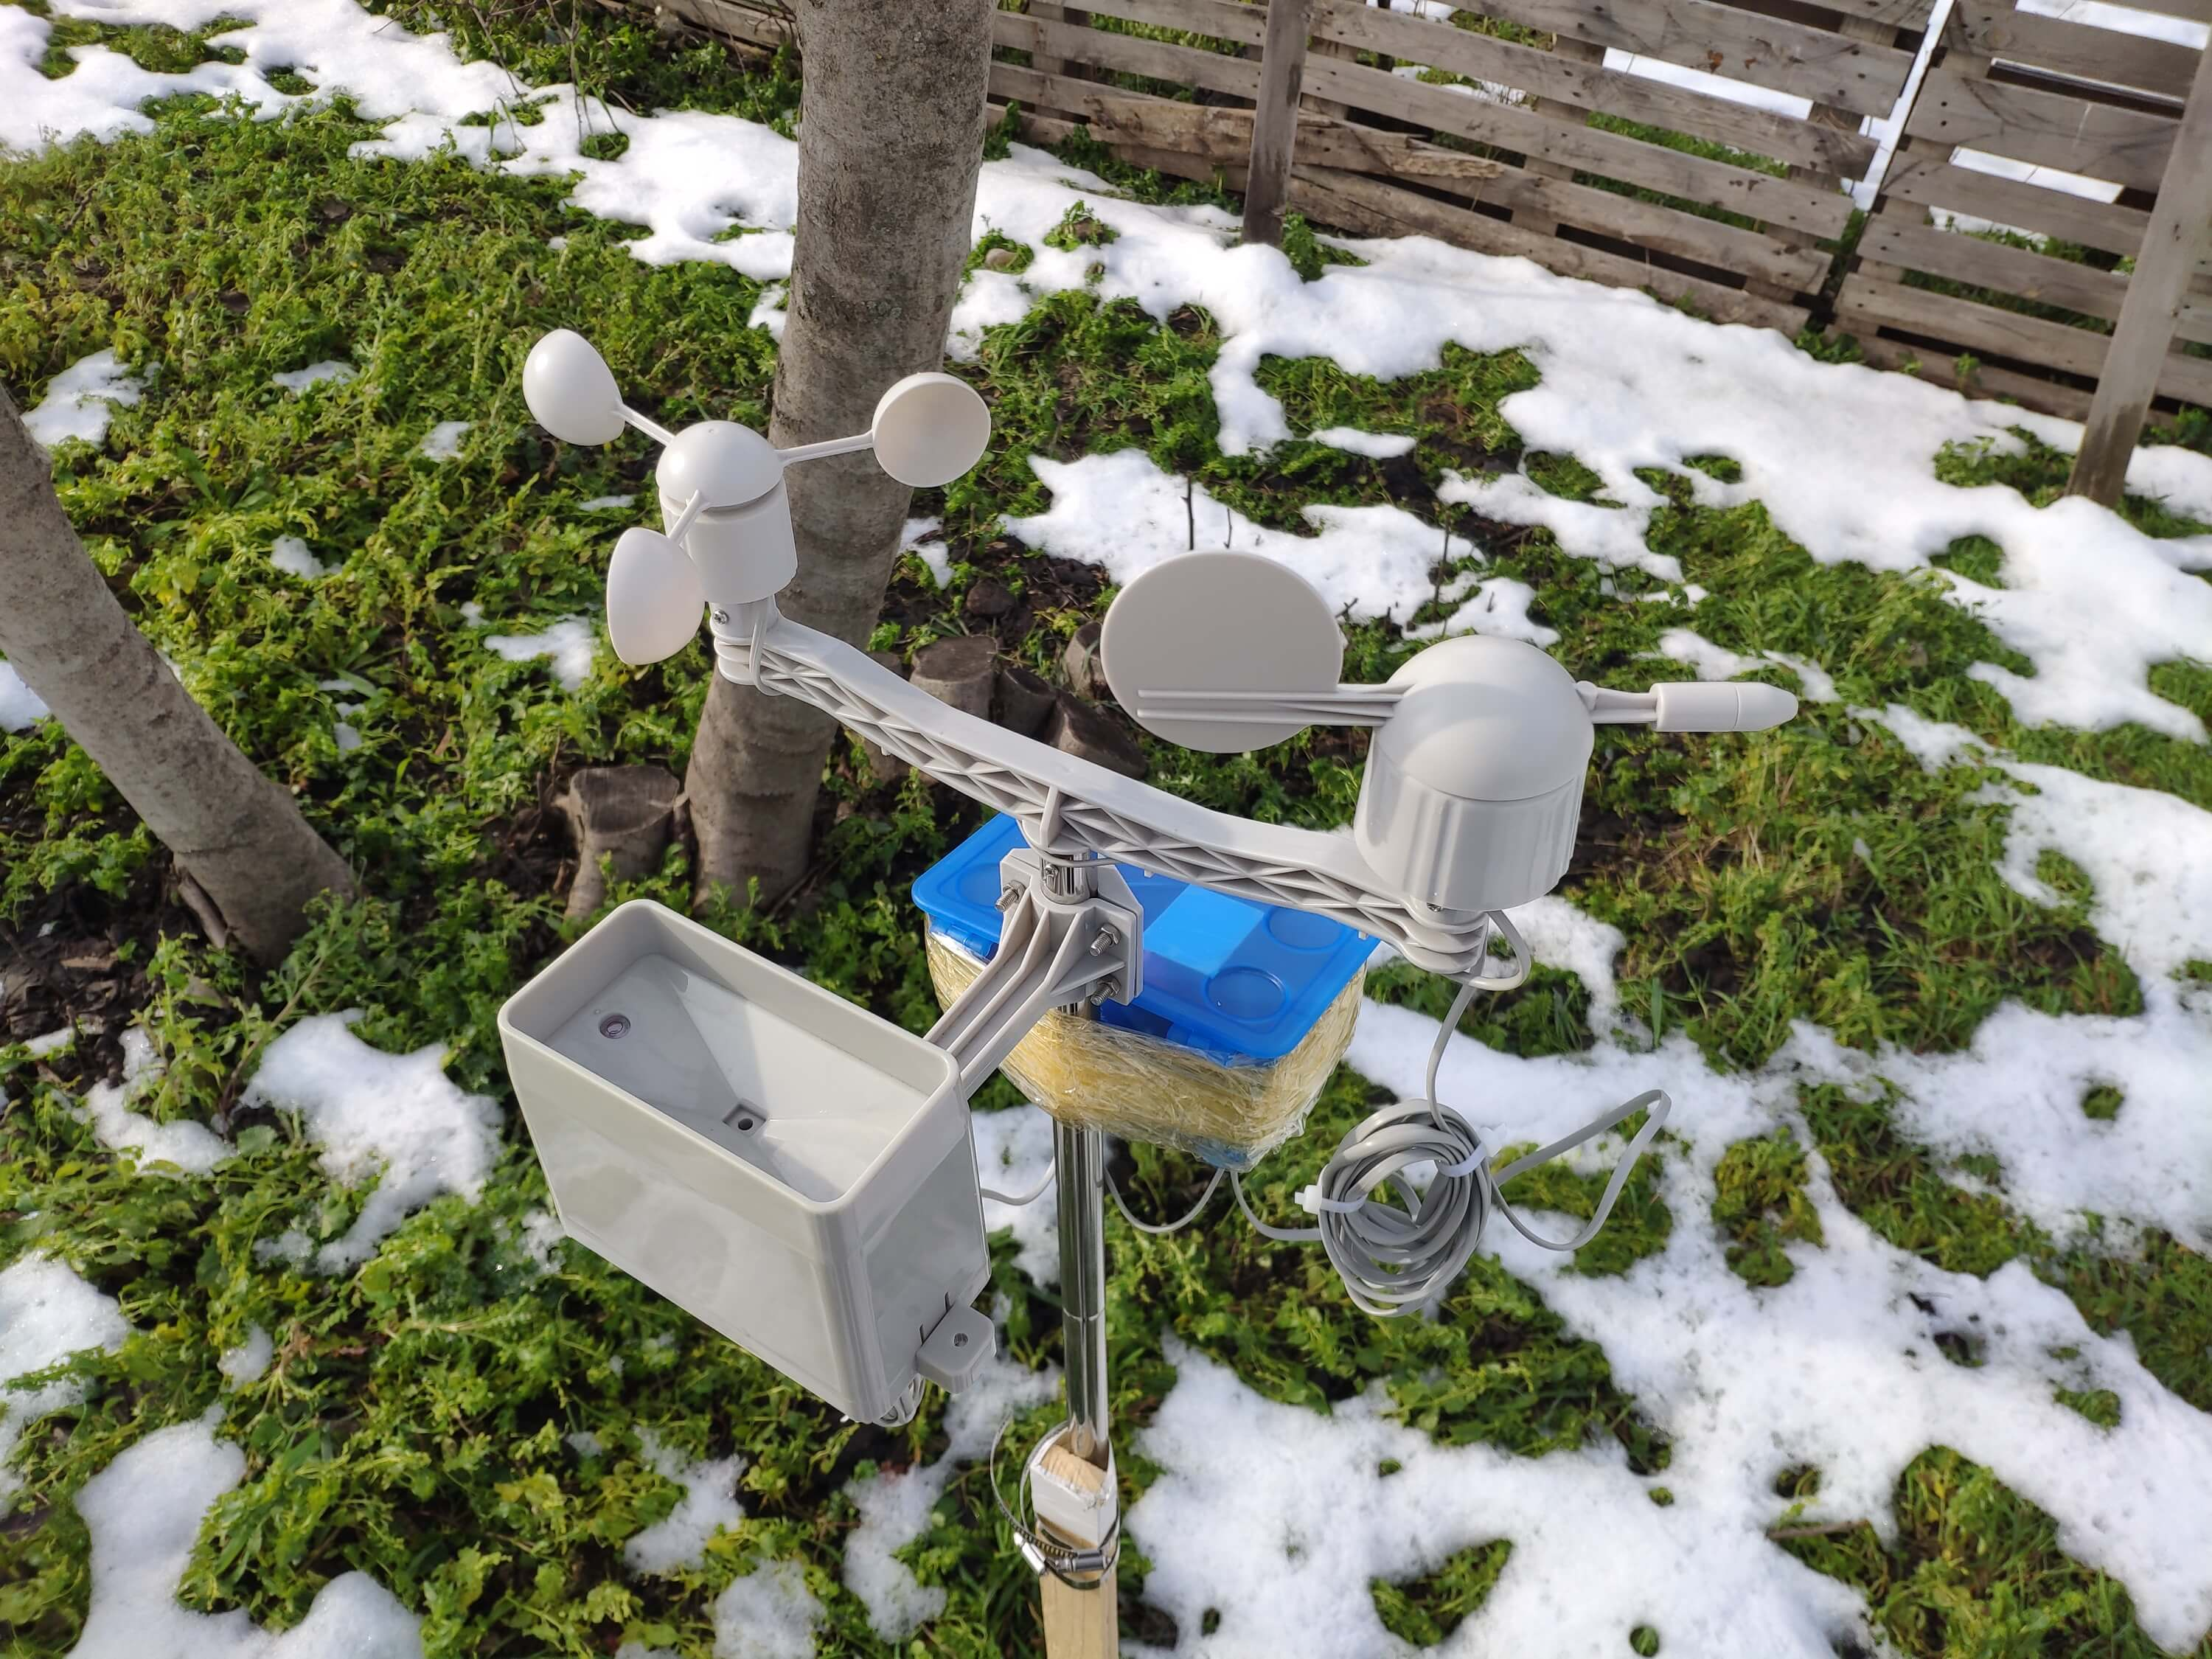
After setting up the SIM808 shield with Arduino Uno, I connected the sensor (converter) board to it.
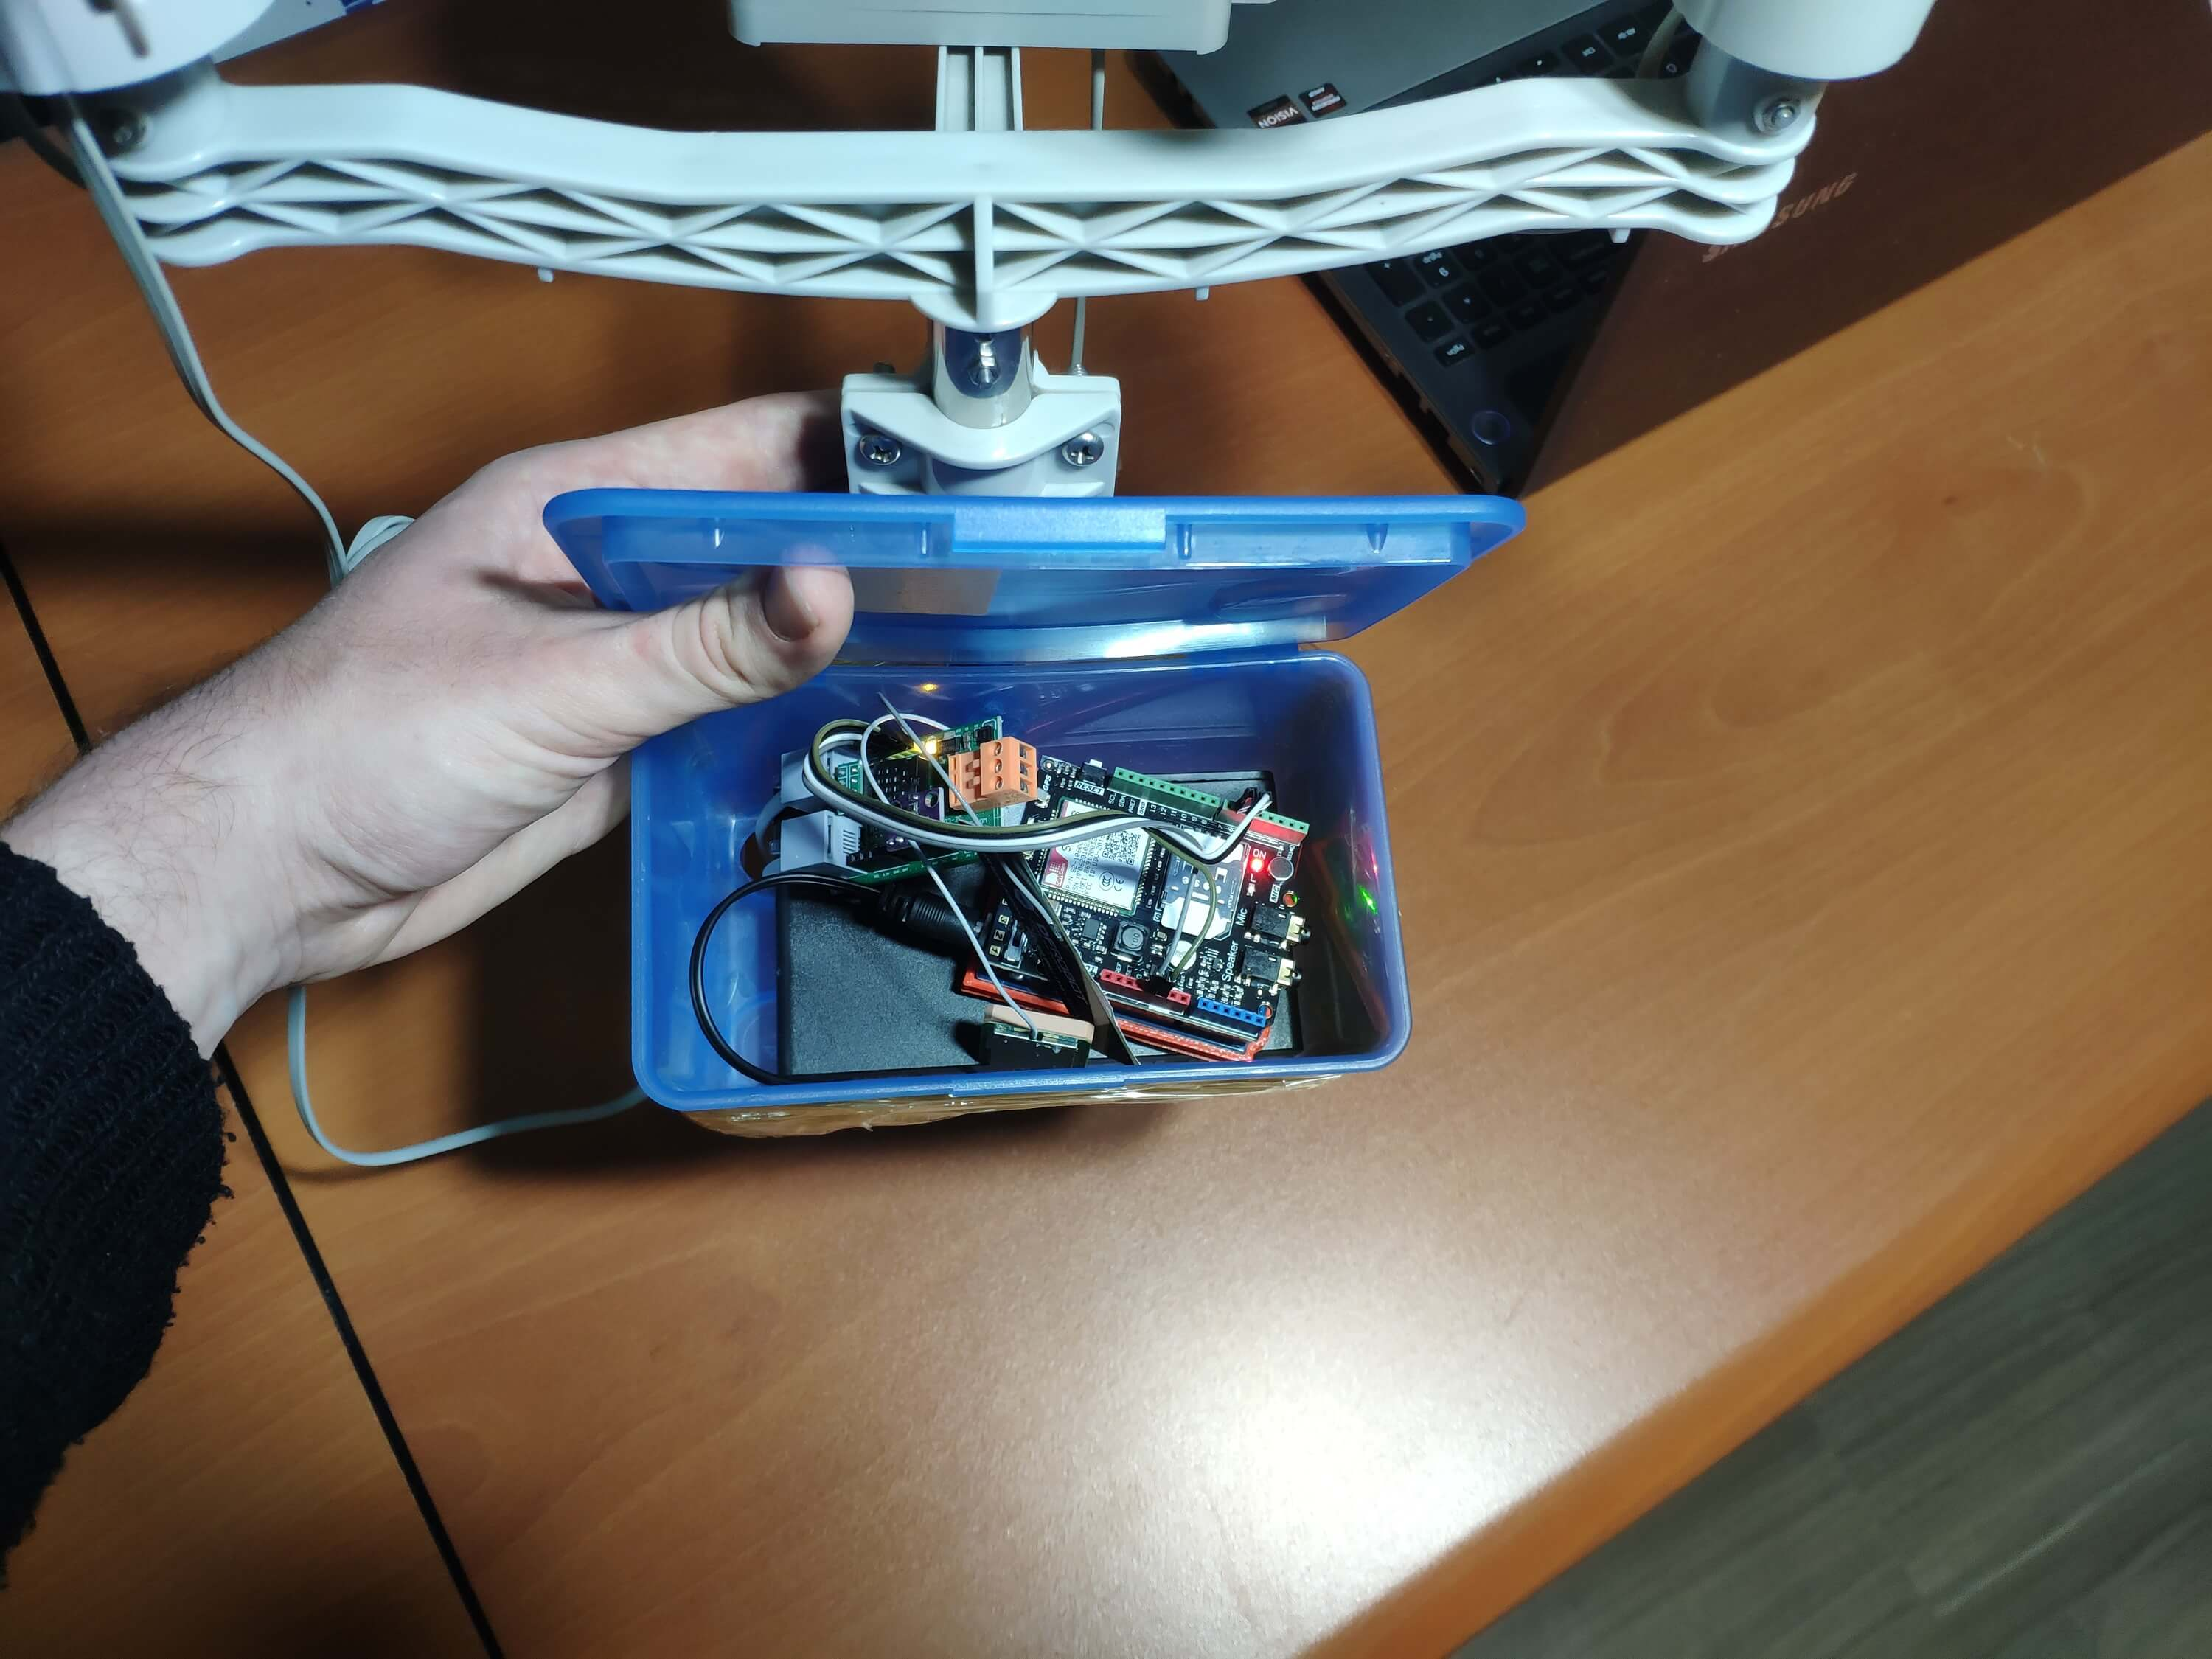
I placed all components into a plastic box to collect weather data outside, even in extreme weather conditions, since the sensor board is not weather-proof.
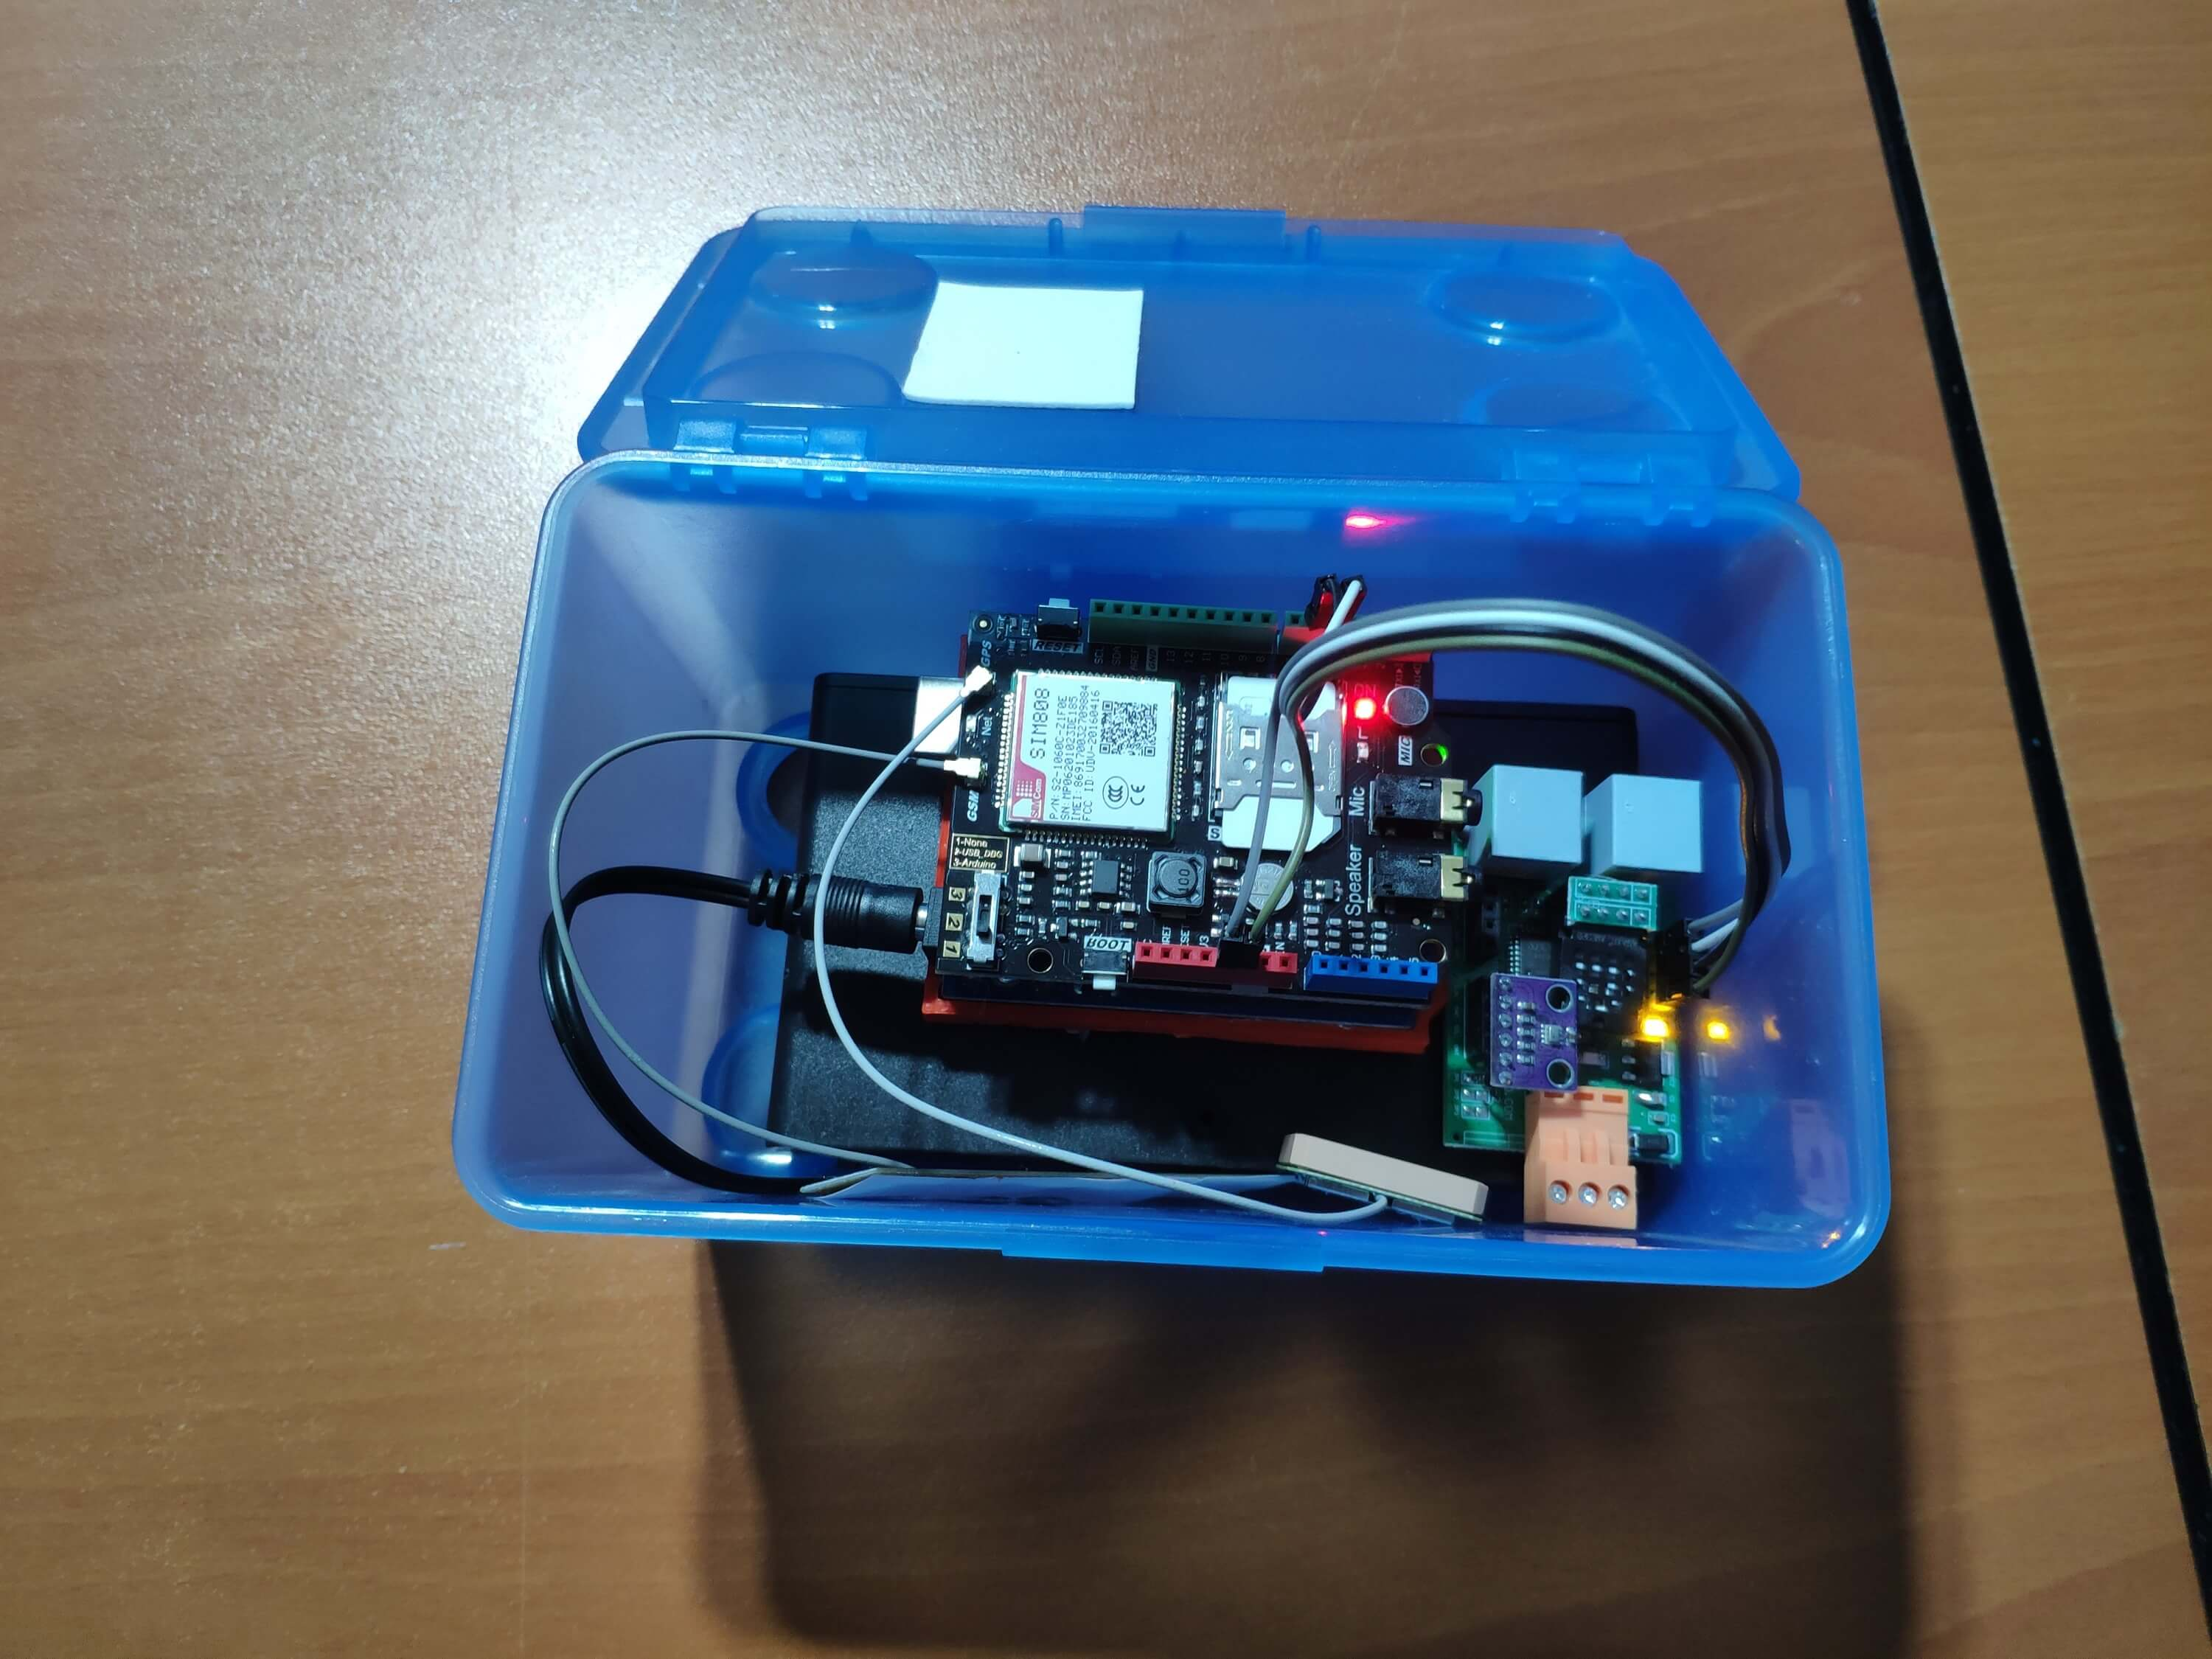
Then, I fastened the plastic box to the weather station.
Videos and Conclusion
After completing coding and assembling the weather station, I collated local weather data for more than three months every five minutes to build my neural network model successfully.
I am still collecting weather data at my balcony and backyard to improve my neural network model and its accuracy :)
Further Discussions
☔ 💧 Since we need local weather data sets to get more accurate predictions on weather phenomena, budget-friendly NN-enabled weather stations like this can be placed on farms and greenhouses to avert the detrimental effects of excessive rainfall on agriculture.
☔ 💧 As early warning systems working with neural networks, we can use them simultaneously to create a swarm of weather stations communicating and feeding each other to forecast rainfall intensity precisely in local areas.
☔ 💧 Also, we can utilize that information for assessing:
- vital water resources,
- agriculture,
- crop productivity,
- ecosystems,
- hydrology.
References
[1] Extreme weather - heavy rainfall , NIWA, https://niwa.co.nz/natural-hazards/extreme-weather-heavy-rainfall
[2] University of Illinois at Urbana-Champaign, News Bureau. "Excessive rainfall as damaging to corn yield as extreme heat, drought. " ScienceDaily. ScienceDaily, 30 April 2019. www.sciencedaily.com/releases/2019/04/190430121744.htm.
[3] Andrew Culclasure, Using Neural Networks to Provide Local Weather Forecasts , Georgia Southern University, Spring 2013, 29https://digitalcommons.georgiasouthern.edu/cgi/viewcontent.cgi?article=1031&context=etd.
Código
- IoT_weather_station_neural_network.py
- ESP12E_remote_weather_station.ino
- SIM808_remote_weather_station.ino
- index.php (web application)
- account_verification_token.php (web application)
IoT_weather_station_neural_network.pyPython
# IoT Weather Station Predicting Rainfall Intensity w/ TensorFlow# Windows, Linux, or Ubuntu# By Kutluhan Aktar# Collates weather data on Google Sheets and interprets it with a neural network built in TensorFlow to make predictions on the rainfall intensity. # For more information:# https://www.theamplituhedron.com/projects/IoT_Weather_Station_Predicting_Rainfall_Intensity_with_TensorFlowimport tensorflow as tffrom tensorflow import kerasimport matplotlib.pyplot as pltimport numpy as npimport pandas as pd# Create a class to build a neural network after getting, visualizing, and scaling (normalizing) weather data.class Weather_Station:def __init__(self, data):self.df =data self.input =[] self.label =[] # Define class names for different rainfall intensity predictions and values. self.class_names =['None', 'Light Rain', 'Moderate Rain', 'Heavy Rain', 'Violent Rain'] # Create graphics for requested columns. def graphics(self, column_1, column_2, xlabel, ylabel):# Show requested columns from the data set:plt.style.use("dark_background") plt.gcf().canvas.set_window_title('IoT Weather Station') plt.hist2d(self.df[column_1], self.df[column_2]) plt.colorbar() plt.xlabel(xlabel) plt.ylabel(ylabel) plt.title(xlabel) plt.show() # Visualize data before creating and feeding the neural network model. def data_visualization(self):# Inspect requested columns to build a model with appropriately formatted data:self.graphics('WD', '1h_RF', 'Wind Direction (deg)', 'One-Hour Rainfall (mm)') self.graphics('Av_WS', '1h_RF', 'Average Wind Speed (m/s)', 'One-Hour Rainfall (mm)') self.graphics('Mx_WS', '1h_RF', 'Maximum Wind Speed (m/s)', 'One-Hour Rainfall (mm)') self.graphics('24h_RF', '1h_RF', '24-Hour Rainfall (mm)', 'One-Hour Rainfall (mm)') self.graphics('Tem', '1h_RF', 'Temperature (C)', 'One-Hour Rainfall (mm)') self.graphics('Hum', '1h_RF', 'Humidity (%)', 'One-Hour Rainfall (mm)') self.graphics('b_PR', '1h_RF', 'Barometric Pressure (hPA)', 'One-Hour Rainfall (mm)') # Scale (normalize) data depending on the neural network model. def scale_data(self):# Wind Direction and Speed:wv =self.df.pop('Av_WS') max_wv =self.df.pop('Mx_WS') # Convert to radians. wd_rad =self.df.pop('WD')*np.pi / 180 # Calculate the wind x and y components. self.df['scaled_WX'] =wv*np.cos(wd_rad) self.df['scaled_WY'] =wv*np.sin(wd_rad) # Calculate the max wind x and y components. self.df['scaled_max_WX'] =max_wv*np.cos(wd_rad) self.df['scaled_max_WY'] =max_wv*np.sin(wd_rad) # Temperature:tem =self.df.pop('Tem') self.df['scaled_Tem'] =tem / 25 # Humidity:hum =self.df.pop('Hum') self.df['scaled_Hum'] =hum / 70 # Barometric Pressure:bPR =self.df.pop('b_PR') self.df["scaled_bPR"] =bPR / 1013 # 24 Hour Rainfall (Approx.) rain_24 =self.df.pop('24h_RF') self.df['scaled_24h_RF'] =rain_24 / 24 # Define the input and label arrays. def create_input_and_label(self):n =len(self.df) # Create the input array using the scaled variables:for i in range(n):self.input.append(np.array([self.df['scaled_WX'][i], self.df['scaled_WY'][i], self.df['scaled_max_WX'][i], self.df['scaled_max_WY'][i], self.df['scaled_Tem'][i], self.df['scaled_Hum'][i], self.df['scaled_bPR'][i]])) self.input =np.asarray(self.input) # Create the label array using the one-hour and 24-hour rainfall variables:for i in range(n):_class =0 # Evaluate the approximate rainfall rate:approx_RF_rate =(self.df['1h_RF'][i] + self.df['scaled_24h_RF'][i]) * 100 # As labels, assign classes of rainfall intensity according to the approximate rainfall rate (mm):if approx_RF_rate ==0:_class =0 elif approx_RF_rate <2.5:_class =1 elif 2.5 ", self.class_names[np.argmax(prediction[i])]) # Save the model for further usage without training steps:def save_model(self):self.model.save("E:\PYTHON\weather_station.h5") # Run Artificial Neural Network (ANN):def Neural_Network(self, save):self.scale_data() self.create_input_and_label() self.split_data() self.build_and_train_model() if save ==True:self.save_model() # Example Input and Layer:print("\nScaled Input [EXP]:\n") print(self.train_input[0]) print("\nScaled Label [EXP]:\n") print(self.train_label[0]) # Read data (Remote Weather Station.csv):csv_path ="E:\PYTHON\Remote Weather Station.csv"df =pd.read_csv(csv_path)# Define a new class object named 'station':station =Weather_Station(df)# Visualize data:#station.data_visualization()# Artificial Neural Network (ANN):station.Neural_Network(False)# Enter inputs for making predictions:prediction_array =np.array([ [0, 0, 0.31819805, 0.31819805, 0.6988, 0.81498571, 0.99349753], [0, -0, 0, -0, 0.8444, 1, 0.96835143], [0, 0, 0.45, 0, 0.87577, 0.95857143, 1.00128332], [-0, -0, -0, -0, 0.8224, 1.05714286, 0.99279368]])# Prediction Results:station.make_prediction(prediction_array) ESP12E_remote_weather_station.inoArduino
///////////////////////////////////////////// // IoT Weather Station Predicting // // Rainfall Intensity w/ TensorFlow // // ------------------------ // // NodeMCU (ESP-12E) // // by Kutluhan Aktar // // // ///////////////////////////////////////////////// Collates weather data on Google Sheets and interprets it with a neural network built in TensorFlow to make predictions on the rainfall intensity. //// For more information:// https://www.theamplituhedron.com/projects/IoT_Weather_Station_Predicting_Rainfall_Intensity_with_TensorFlow//// Connections// NodeMCU (ESP-12E) :// Weather Station// VV --------------------------- 5V// D5 --------------------------- RX// D6 --------------------------- TX// G --------------------------- GND// Include required libraries:#include#include #include #include #include // Define your WiFi settings.const char *ssid =" ";const char *password =" ";// Define weather station settings:char databuffer[35];double temp;int transferring =0;// Define the serial connection pins - RX and TX.SoftwareSerial Serial_1(D6, D5); // (Rx, Tx)void setup() { // Wait until connected. atraso (1000); // Initiate serial ports:Serial.begin(115200); Serial_1.begin(9600); // It is just for assuring if connection is alive. WiFi.mode(WIFI_OFF); atraso (1000); // This mode allows NodeMCU to connect any WiFi directly. WiFi.mode(WIFI_STA); // Connect NodeMCU to your WiFi. WiFi.begin(ssid, password); Serial.print("\n\n"); Serial.print("Try to connect to WiFi. Please wait! "); Serial.print("\n\n"); // Halt the code until connected to WiFi. enquanto (WiFi.status ()! =WL_CONNECTED) {atraso (500); Serial.print("*"); } // If connection is successful:Serial.print("\n\n"); Serial.print("-------------------------------------"); Serial.print("\n\n"); Serial.print("Connection is successful!"); Serial.print("\n\n"); Serial.print("Connected WiFi SSID :"); Serial.print(ssid); Serial.print("\n\n"); Serial.println("Connected IPAddress :"); Serial.println(WiFi.localIP()); Serial.print("\n\n");}void loop() { // Get data from the remote weather station:getBuffer(); // Debug the information and create the link:String weather_data ="wd=" + String(WindDirection()) + "&a_ws=" + String(WindSpeedAverage()) + "&m_ws=" + String(WindSpeedMax()) + "&1_rf=" + String(RainfallOneHour()) + "&24_rf=" + String(RainfallOneDay()) + "&tem=" + String(Temperature()) + "&hum=" + String(Humidity()) + "&b_pr=" + String(BarPressure()); String server ="http://192.168.1.24/remote_weather_station/?"; Serial.println("Weather Data => " + weather_data); Serial.println("Buffer => " + String(databuffer)); // Send data packets every 5 minutes to Raspberry Pi (or any server). transferring++; Serial.println("Time => " + String(transferring) + "s / " + String(int(5*60)) + "s\n\n"); if(transferring ==5*60){ // Create the HTTP object to make a request to the server. HTTPClient http; http.begin(server + weather_data); int httpCode =http.GET(); String payload =http.getString(); Serial.println("Data Send...\nHTTP Code => " + String(httpCode) + "\nServer Response => " + payload + "\n\n"); http.end(); transferring =0; } // Wait 1 second... delay(1000);}// WEATHER STATIONvoid getBuffer(){ int index; for (index =0;index <35;index ++){ if(Serial_1.available()){ databuffer[index] =Serial_1.read(); if (databuffer[0] !='c'){ index =-1; } } else{ index --; } }}int transCharToInt(char *_buffer, int _start, int _stop){ int _index; int result =0; int num =_stop - _start + 1; int _temp[num]; for (_index =_start;_index <=_stop;_index ++){ _temp[_index - _start] =_buffer[_index] - '0'; result =10*result + _temp[_index - _start]; } return result;}int WindDirection(){ return transCharToInt(databuffer,1,3); } // Wind Direction (deg)float WindSpeedAverage(){ temp =0.44704 * transCharToInt(databuffer,5,7); return temp; } // Average Air Speed (1 minute)float WindSpeedMax(){ temp =0.44704 * transCharToInt(databuffer,9,11); return temp; } //Max Air Speed (5 minutes)float Temperature(){ temp =(transCharToInt(databuffer,13,15) - 32.00) * 5.00 / 9.00; return temp; } // Temperature ("C")float RainfallOneHour(){ temp =transCharToInt(databuffer,17,19) * 25.40 * 0.01; return temp; } // Rainfall (1 hour)float RainfallOneDay(){ temp =transCharToInt(databuffer,21,23) * 25.40 * 0.01; return temp; } // Rainfall (24 hours)int Humidity(){ return transCharToInt(databuffer,25,26); } // Humidity (%)float BarPressure(){ temp =transCharToInt(databuffer,28,32); return temp / 10.00; } // Barometric Pressure (hPA)
SIM808_remote_weather_station.inoArduino
///////////////////////////////////////////// // IoT Weather Station Predicting // // Rainfall Intensity w/ TensorFlow // // ------------------------ // // Arduino Uno (SIM808) // // by Kutluhan Aktar // // // ///////////////////////////////////////////////// Collates weather data on Google Sheets and interprets it with a neural network built in TensorFlow to make predictions on the rainfall intensity. //// For more information:// https://www.theamplituhedron.com/projects/IoT_Weather_Station_Predicting_Rainfall_Intensity_with_TensorFlow//// Connections// Arduino Uno:// SIM808 GPS/GPRS/GSM Shield For Arduino// D0 --------------------------- RX// D1 --------------------------- TX// D12 --------------------------- POWER // Weather Station// 5V --------------------------- 5V// D5 --------------------------- RX// D6 --------------------------- TX// GND --------------------------- GND// Include required libraries:#include#include // Define the sim808.DFRobot_SIM808 sim808(&Serial);// Define weather station settings:char databuffer[35];double temp;int transferring =0;// Define the serial connection pins - RX and TX.SoftwareSerial Serial_1(6, 5); // (Rx, Tx)void setup() { // Wait until connected. atraso (1000); // Initiate serial ports:Serial.begin(9600); Serial_1.begin(9600); //******** Initialize sim808 module ************* while(!sim808.init()) { delay(1000); Serial.print("Sim808 init error\r\n"); } delay(2000); // Continue if the SIM808 Module is working accurately. Serial.println("Sim808 init success"); delay(5000);}void loop() { // Get data from the remote weather station:getBuffer(); // Debug the information and create the link:String weather_data_1 ="wd=" + String(WindDirection()) + "&a_ws=" + String(WindSpeedAverage()) + "&m_ws=" + String(WindSpeedMax()); String weather_data_2 ="&1_rf=" + String(RainfallOneHour()) + "&24_rf=" + String(RainfallOneDay()) + "&tem=" + String(Temperature()); String weather_data_3 ="&hum=" + String(Humidity()) + "&b_pr=" + String(BarPressure()); Serial.print("Weather Data => " + weather_data_1); Serial.print(weather_data_2); Serial.println(weather_data_3); Serial.println("Buffer => " + String(databuffer)); // Send data packets every 5 minutes to the server. transferring++; Serial.println("Time => " + String(transferring) + "s / " + String(int(5*60)) + "s\n\n"); if(transferring ==5*60){ //*********** Attempt DHCP ******************* while(!sim808.join(F("cmnet"))) { Serial.println("Sim808 join network error!"); atraso (2000); } //************ Successful DHCP **************** delay(5000); Serial.println("Successful DHCP"); //*********** Establish a TCP connection ************ if(!sim808.connect(TCP,"192.168.1.24", 80)) { // Change it with your server. Serial.println("Connection Error"); }else{ Serial.println("Connection OK"); } delay(2000); //*********** Send a GET request ***************** String line ="GET /remote_weather_station/?" + weather_data_1 + weather_data_2 + weather_data_3 + " HTTP/1.0\r\n\r\n"; Serial.println(line); char buffer[512]; // Convert the line from string to char array to make an HTTP Get Request with the SIM808. char web_hook[110]; String_to_Char(line, 110, web_hook); sim808.send(web_hook, sizeof(web_hook)-1); while (true) { int ret =sim808.recv(buffer, sizeof(buffer)-1); if (ret <=0){ Serial.println("Fetch Over..."); pausa; } // Uncomment to view the response in the serial monitor. /* buffer[ret] ='\0'; Serial.print("Recv:"); Serial.print(ret); Serial.print(" bytes:"); Serial.println(buffer); */ Serial.println("\nData Send"); pausa; } //************* Close TCP or UDP connections ********** sim808.close(); //*** Disconnect wireless connection, Close Moving Scene ******* sim808.disconnect(); // Exit. transferring =0; } // Wait 1 second... delay(1000);}// WEATHER STATIONvoid getBuffer(){ int index; for (index =0;index <35;index ++){ if(Serial_1.available()){ databuffer[index] =Serial_1.read(); if (databuffer[0] !='c'){ index =-1; } } else{ index --; } }}int transCharToInt(char *_buffer, int _start, int _stop){ int _index; int result =0; int num =_stop - _start + 1; int _temp[num]; for (_index =_start;_index <=_stop;_index ++){ _temp[_index - _start] =_buffer[_index] - '0'; result =10*result + _temp[_index - _start]; } return result;}int WindDirection(){ return transCharToInt(databuffer,1,3); } // Wind Direction (deg)float WindSpeedAverage(){ temp =0.44704 * transCharToInt(databuffer,5,7); return temp; } // Average Air Speed (1 minute)float WindSpeedMax(){ temp =0.44704 * transCharToInt(databuffer,9,11); return temp; } //Max Air Speed (5 minutes)float Temperature(){ temp =(transCharToInt(databuffer,13,15) - 32.00) * 5.00 / 9.00; return temp; } // Temperature ("C")float RainfallOneHour(){ temp =transCharToInt(databuffer,17,19) * 25.40 * 0.01; return temp; } // Rainfall (1 hour)float RainfallOneDay(){ temp =transCharToInt(databuffer,21,23) * 25.40 * 0.01; return temp; } // Rainfall (24 hours)int Humidity(){ return transCharToInt(databuffer,25,26); } // Humidity (%)float BarPressure(){ temp =transCharToInt(databuffer,28,32); return temp / 10.00; } // Barometric Pressure (hPA)void String_to_Char(String _String, int _size, char _convert[]){ for(int i=0;i<_size;i++){ _convert[i] =_String[i]; }}
index.php (web application)PHP
 (int)$_GET['wd'], "a_ws" => (float)$_GET['a_ws'], "m_ws" => (float)$_GET['m_ws'], "1_rf" => (float)$_GET['1_rf'], "24_rf" => (float)$_GET['24_rf'], "tem" => (float)$_GET['tem'], "hum" => (int)$_GET['hum'], "b_pr" => (float)$_GET['b_pr'] ];}else{ $variables_from_module =[ "wd" => "err", "a_ws" => "err", "m_ws" => "err", "1_rf" => "err", "24_rf" => "err", "tem" => "err", "hum" => "err", "b_pr" => "err" ];}/** * Returns an authorized API client. * @return Google_Client the authorized client object */function getClient(){ $client =new Google_Client(); $client->setApplicationName('Remote Weather Station'); // Enter your application name. $client->setScopes('https://www.googleapis.com/auth/spreadsheets'); $client->setAuthConfig('credentials.json'); $client->setAccessType('offline'); $client->setPrompt('select_account consent'); // Load previously authorized token from a file, if it exists. // The file token.json stores the user's access and refresh tokens, and is // created automatically when the authorization flow completes for the first // time. $tokenPath ='token.json'; if (file_exists($tokenPath)) { $accessToken =json_decode(file_get_contents($tokenPath), true); $client->setAccessToken($accessToken); print("Token Found!"); } // If there is no previous token or it's expired. if ($client->isAccessTokenExpired()) { // Refresh the token if possible, else fetch a new one. if ($client->getRefreshToken()) { $client->fetchAccessTokenWithRefreshToken($client->getRefreshToken()); } else { // Request authorization from the user. $authUrl =$client->createAuthUrl(); // Do not forget to refresh the page after getting the verification code and entering it to the account_verification_token.php. printf("Open the following link in your browser:

%s

", $authUrl); // <=Comment print 'Do not forget to refresh the page after getting the verification code and entering it to the account_verification_token.php.

Set the verification code in the account_verification_token.php file.'; // <=Comment // Set the verification code to create the token.json. $authCode =trim($GLOBALS['account_verification_token']); // Exchange authorization code for an access token. $accessToken =$client->fetchAccessTokenWithAuthCode($authCode); $client->setAccessToken($accessToken); // Check to see if there was an error and the account_verification_token is entered. if (array_key_exists('error', $accessToken)) { throw new Exception(join(', ', $accessToken)); }else{ print("Successful! Refresh the page."); } } // Save the token to a file. if (!file_exists(dirname($tokenPath))) { mkdir(dirname($tokenPath), 0700, true); } file_put_contents($tokenPath, json_encode($client->getAccessToken())); } return $client;}// Get the API client and construct the service object.$client =getClient();$service =new Google_Service_Sheets($client);// Enter your spreadsheetId:$spreadsheetId ='';// Enter the range (the first row) under which new values will be appended (8 rows):$range ='A1:H1';// Append recent findings from the weather station to the spreadsheet.$values =[ [$variables_from_module["wd"], $variables_from_module["a_ws"], $variables_from_module["m_ws"], $variables_from_module["1_rf"], $variables_from_module["24_rf"], $variables_from_module["tem"], $variables_from_module["hum"], $variables_from_module["b_pr"]]];$body =new Google_Service_Sheets_ValueRange([ 'values' => $values]);$params =[ 'valueInputOption' => "RAW"];// Append if only requested!if(isset($_GET['wd']) &&isset($_GET['a_ws']) &&isset($_GET['m_ws']) &&isset($_GET['1_rf']) &&isset($_GET['24_rf']) &&isset($_GET['tem']) &&isset($_GET['hum']) &&isset($_GET['b_pr'])){ $result =$service->spreadsheets_values->append($spreadsheetId, $range, $body, $params); printf("

%d cells appended.", $result->getUpdates()->getUpdatedCells());}else{ print ("
Missing Data!");}
account_verification_token.php (web application)PHP
"; // Enter the verification code after authorization. ?>
Peças personalizadas e gabinetes
remote_weather_station_OobOCQNPSW.csvEsquemas
Jogo Chrome Dinosaur controlado na vida real
E-Health:Sensores de baixo custo para detecção precoce de doenças
Processo de manufatura
- Estação meteorológica baseada no Raspberry Pi
- Estação meteorológica Raspberry Pi 2
- Estação meteorológica Raspberry Pi
- Projeto IoT 101:Temperatura do Fluxo do Raspberry Pi
- Monitoramento remoto do clima usando Raspberry Pi
- Junte-se ao IOT com sua estação meteorológica - CWOP
- Java ME 8 + Raspberry Pi + Sensores =IoT World (Parte 1)
- Projeto Raspberry PI IoT Conectando o Sensor DHT11
- Windows 10 IoT Core no Raspberry Pi 2 - Dados do sensor Adafruit
- Estação meteorológica V 2.0