


Minúsculas nanopartículas de fluoreto de terras raras ativam o crescimento de células tumorais por meio de interações polares elétricas
Resumo
As interações extracelulares localizadas entre nanopartículas e receptores de sinal transmembrana podem muito bem ativar o crescimento de células cancerosas. Aqui, minúsculo LaF 3 e PrF 3 nanopartículas em suspensões de DMEM + FBS estimularam o crescimento de células tumorais em três diferentes linhagens de células humanas (A549, SW837 e MCF7). A distribuição do tamanho das nanopartículas, a ativação das vias de sinalização AKT e ERK e os testes de viabilidade apontaram para a estimulação mecânica dos sítios de ligação de adesão do ligante de integrinas e EGFR por meio de uma ação sinérgica de um conjunto de nanopartículas de tamanho minúsculo (<10 nm). Embora nanopartículas de tamanho minúsculo possam estar bem associadas à ativação do EGFR, a interação da integrina com as nanopartículas permanece um problema multifacetado. Um motivo teórico mostra que, dentro da escala de força pN necessária, cada sítio de ligação de adesão de ligante pode ser ativado por uma nanopartícula dielétrica de tamanho minúsculo via interação de dipolo elétrico. O tamanho da nanopartícula ativa ficou especificado pela quantidade de cargas superficiais no local de adesão do ligante e da nanopartícula, e também pela distância de separação entre eles. O componente polar da força dipolar elétrica permaneceu inversamente proporcional à segunda potência do tamanho das nanopartículas, evidenciando que apenas nanopartículas dielétricas de tamanho minúsculo podem estimular o crescimento de células cancerosas por meio de interações dipolares elétricas. O trabalho contribui para o reconhecimento dos diferentes modos de estresse citoesquelético das células cancerígenas.
Histórico
A tumorigênese é um problema multidimensional que envolve mudanças genômicas. Também é ativada por interações célula-matriz extracelular (ECM) entre scaffolds e estruturas citoesqueléticas [1,2,3,4] expressas via estresse de mecanossensores, semelhante às integrinas, de forças celulares multipartes capazes de alterar a programação genômica [5]. As interações do microambiente tumoral com os andaimes de ECM geralmente ativam proteínas de adesão focal da membrana celular e receptores de sinal transmembrana (TSR), receptores do fator de crescimento epidérmico (EGFR), fator de crescimento endotelial vascular (VEGFR) ou receptores do fator de crescimento nervoso (NGFR). Os mecanossensores regulam o crescimento das células tumorais via transação de sinal entre o domínio ativo extracelular das células [6,7,8,9] e os filamentos de F-actina intracelular, desencadeando uma avalanche de reações de fosforilação.
As alterações conformacionais das proteínas e a excitação das vias de TSR requerem que a força de ativação esteja na faixa de força pN, e certamente abaixo do calibre nN [10]. Além do estresse mecânico aleatório e da força de afinidade química ativa, a eficiência de ligação (força de ligação) entre as nanopartículas (NPs) e as proteínas da membrana celular pode ser modulada por meio de pólos elétricos de curto ou longo alcance ou outros tipos de interações dispersivas. Na área de superfície limitada de NPs, apenas um certo número de proteínas pode ser anexado por tempo suficiente para ser biologicamente ativo [11], e as interações locais confinadas no espaço com o meio biológico foram reconhecidas como responsáveis por um conjunto de funcionalidade celular divergente rotas [12]. Consequentemente, as vias de transação de sinal da interação proteína-NPs estão sinalizando problemas de segurança para NPs [11, 13].
Como a resposta favorável ou adversa em células de NPs é específica do tipo [11], a ligação entre NPs e marcas biológicas deve ser estabelecida caso a caso [14, 15].
Resultados contraditórios de células tumorais expostas a NPs, tanto para eficiências de crescimento ablativo ou tumoral ou níveis de toxicidade variáveis de NPs [16, 17], também estão trazendo à tona os problemas de segurança. No entanto, apesar do progresso, hoje existe uma falta de conhecimento sobre as vias específicas pelas quais os PNs interagem com as células eucarióticas, impossibilitando a identificação de uma abordagem terapêutica universal para PNs. Como NPs de tamanhos diferentes e químicas de superfície diversas geralmente desviam as respostas celulares, incluindo NPs-ligação ao receptor de membrana e atividade de TSRs, a toxicidade dos NPs está relacionada com a morfologia dos surfactantes, o estado de carga elétrica, a concentração e composição de proteínas e nanomateriais na ECM [18,19,20,21] e, finalmente, a força da ligação molecular entre NPs e os fenótipos celulares [22].
Estudos anteriores de melanoma e carcinomas cervicais expostos a sílica, NPs de ouro e nanotubos de carbono reconheceram que o tamanho dos NPs ativa o crescimento das células tumorais seletivamente [23,24,25,26,27]. A correlação entre os sinais de TSR na linha de células de câncer humano SK-BR-3 e o tamanho de NPs de ouro e prata modificados demonstrou que, embora NPs de tamanho de 2 a 100 nm reformassem a transdução de sinal, uma imensa diferença na atividade apoptótica foi atingida quando as células interagiram com 40 –50 nm NPs de tamanho [26]. Recentemente, também foi sugerido que alterando o tamanho das NPs de ouro de 5 para 40 nm, as taxas de crescimento das linhas de células cancerosas A549 e 95D foram concebivelmente ajustadas. Especificamente, NPs de tamanho 5 nm inibiram qualquer proliferação de ambos os tipos de células, enquanto NPs de tamanho ~ 10 nm não tiveram nenhum efeito no crescimento celular [27]. Da mesma forma, células A549 e THP-1 expostas a SiO 2 NPs exibiram citotoxicidade dependente do tamanho, bem como NPs de tamanho de 15 nm também foram correlacionados com altos níveis de citotoxicidade. Pelo contrário, NPs com tamanho de 60 nm exibiram menor toxicidade. Finalmente, NPs de tamanho de 200 nm aumentaram o crescimento de células-tronco por meio da ativação de ERK1 / 2, enquanto NPs de tamanho de 2–4 μm foram capazes de ativar diferentes vias de transdução de sinal [28]. NPs de pequeno tamanho conjugam o EGFR e ligam a proteína quinase B (AKT) e as vias de transação de sinal de quinase regulada por sinal extracelular (ERK) que inflamam o crescimento celular.
Nanopartículas de terras raras (RE-NPs) também podem interagir com domínios específicos, como sítios de adesão dependentes de íons metálicos (MIDAS), ajuste a MIDAS (ADMIDAS), sítios de ligação de íons metálicos sinérgicos (SyMBS) e sítio de ligação de adesão de ligante (LABS) , localizado no α ν β 3 subunidade ou outras subunidades de integrinas [29, 30].
Da mesma forma, RE-NPs acarretam um grau adicional de flexibilidade na interação de NPs tumorais [31,32,33,34]. Enquanto NPs de ceria (nanoceria) exibiram uma ação protetora contra danos celulares por radicais diferentes [35], os níveis de baixa concentração de NPs de ceria modificados aumentaram fortemente a proliferação de células de hepatoma reduzindo a apoptose via ativação de vias de sinalização AKT / ERK [36]. Normalmente, um conjunto de NPs ao redor da célula é responsável pelo estresse do citoesqueleto e igualmente se destaca pela interação química, nano termodinâmica (Hill) [37], entrópica ou de dipolo elétrico entre NPs e mecanossensores. No entanto, até agora, um caso de compreensão das interações entre NPs, TSRs e células permanece vago e indisponível.
Em princípio, o caráter iônico forte dos compostos RE deve estimular os mecanossensores das células por meio de interações elétricas. Além disso, como os íons RE são amplamente usados em diferentes aplicações, é vital examinar sua contribuição potencial para o crescimento de células tumorais para implicar em protocolos de proteção de saúde pública apropriados. Fluoreto de lantânio (LaF 3 ) e fluoreto de praseodímio (PrF 3 ) são usados em lâmpadas fluorescentes, vidros coloridos de radiação, fibras ópticas, aplicações de esmalte e eletrodos. LaF 3 é elaborado em um tipo específico de vidros, revestimentos de lâmpadas de fósforo, tratamento de água e catalisadores. É também um componente essencial de um vidro de fluoreto comercial (ZBLAN), que misturado com fluoreto de európio é usado para comunicações ópticas e como membrana de cristal em eletrodos de fluoreto íon-seletivo com uma boa transmitância no infravermelho. Igualmente, PrF 3 também é empregado em luzes de arco de carbono para a indústria cinematográfica, iluminação de estúdio e luzes de projetor. Vidros de fluoreto dopados com praseodímio também são usados em amplificadores óticos de fibra monomodo.
Desse modo, este trabalho demonstra que RE-NPs de tamanho minúsculo têm a potência de estimular o crescimento de células tumorais por meio de interações de dipolo elétrico.
O artigo está organizado em três seções. Em primeiro lugar, a distribuição de tamanho, as interações e a geometria dos NPs são analisados aplicando espalhamento de luz dinâmico (DLS), microscopia de força atômica (AFM), microscopia eletrônica de transmissão (TEM), difração de raios-X (XRD), bidimensional rápido Análise de transformada de Fourier (2D-FFT) e espectroscopia ultravioleta de vácuo (VUV 110-180 nm). Em seguida, a correlação entre o nível de crescimento de três diferentes linhas de células de câncer humano (A549, SW837 e MCF7) com a distribuição de tamanho e a concentração de LaF 3 e PrF 3 NPs é estabelecido. Finalmente, dentro de um limite de força necessário de 1 pN para ativar os mecanossensores e, subsequentemente, o crescimento das células tumorais, a viabilidade das células tumorais é ajustada dentro de um motivo teórico de interação de dipolo elétrico entre um RE-NP e um LABS. O trabalho contribui para a identificação e classificação de diferentes tipos de estresse citoesquelético e interações entre NPs e mecanossensoriais de células cancerígenas.
Resultados
Tamanho e estrutura de NPs
Primeiro, espectroscopia DLS, AFM, TEM, XRD, FFT, VUV e t estatísticas de teste foram aplicadas para extrair a distribuição de tamanho de RE-NPs em suspensões líquidas (Figs. 1, 2, 3, 4, 5, 6 e 7). Em seguida, testes de viabilidade de células e ensaios de Western blotting (Wb) foram usados para identificar a ativação de mecanossensores específicos por RE-NPs.
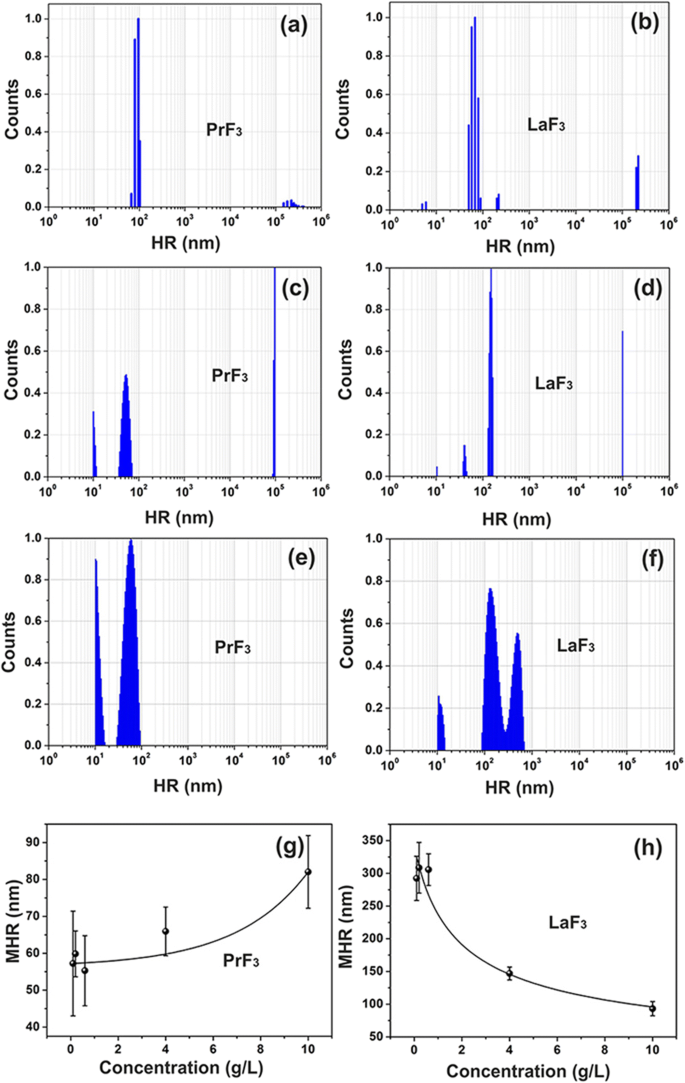
Espectros de distribuição de tamanho DLS de suspensões RE. a, b PrF 3 e LaF 3 NPs (5 g / L) em água. c, d PrF 3 e LaF 3 NPs (5 g / L) em DMEM + FBS. e, f PrF 3 e LaF 3 NPs (0,1 g / L) em DMEM + FBS. g, h Raio hidrodinâmico médio (MHR) com desvio padrão de PrF 3 e LaF 3 NPs em DMEM + FBS em diferentes níveis de concentração
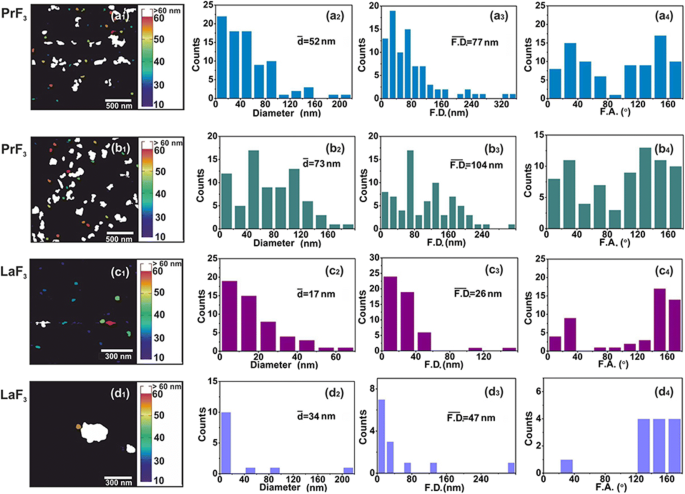
AFM digital ( x , y ) histogramas de tamanho de RE-NPs. ( a1 – d1 ) PrF 3 (2 × 2 μm 2 ) e LaF 3 (1 × 1 μm 2 ) NPs em suspensões de DMEM + FBS. ( a2 – d2 ) ( x , y ) histogramas de tamanho de diâmetro médio da área do círculo igual \ (\ left (\ overline {d} \ right) \) de RE-NPs. (a3 – d3) ( x , y ) histogramas de tamanho dos diâmetros da área de Feret \ (\ left (\ overline {\ F.D.} \ right) \) de RE-NPs. ( a4 – d4 ) Histogramas do ângulo de Feret (F.A.) em relação ao x -eixo. RE-NPs foram orientados ao longo de duas direções principais entre ± (44-60 °)
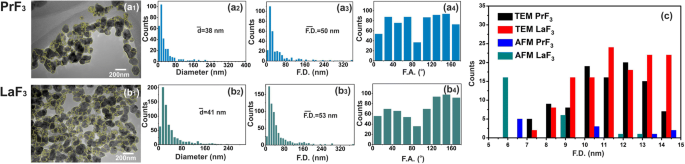
TEM digital ( x , y ) histogramas de tamanho de RE-NPs. ( a1, b1 ) Imagens TEM de RE-NPs. As linhas amarelas indicaram limites 2D entre RE-NPs. ( a2, b2 ) ( x , y ) histogramas de tamanho de diâmetro médio da área do círculo igual \ (\ left (\ overline {d} \ right) \) de RE-NPs. ( a3, b3 ) ( x , y ) histogramas de tamanho do diâmetro da área de Feret \ (\ left (\ overline {\ F.D.} \ right) \) de RE-NPs. ( a4, b4 ) Histogramas do ângulo de Feret (F.A.) em relação ao x -eixo com direções preferenciais em ± (44–60 °). ( c ) Histograma de tamanho do diâmetro de Feret de RE-NPs de tamanho pequeno e minúsculo extraídos de imagens AFM e TEM por 4 μm 2 áreas
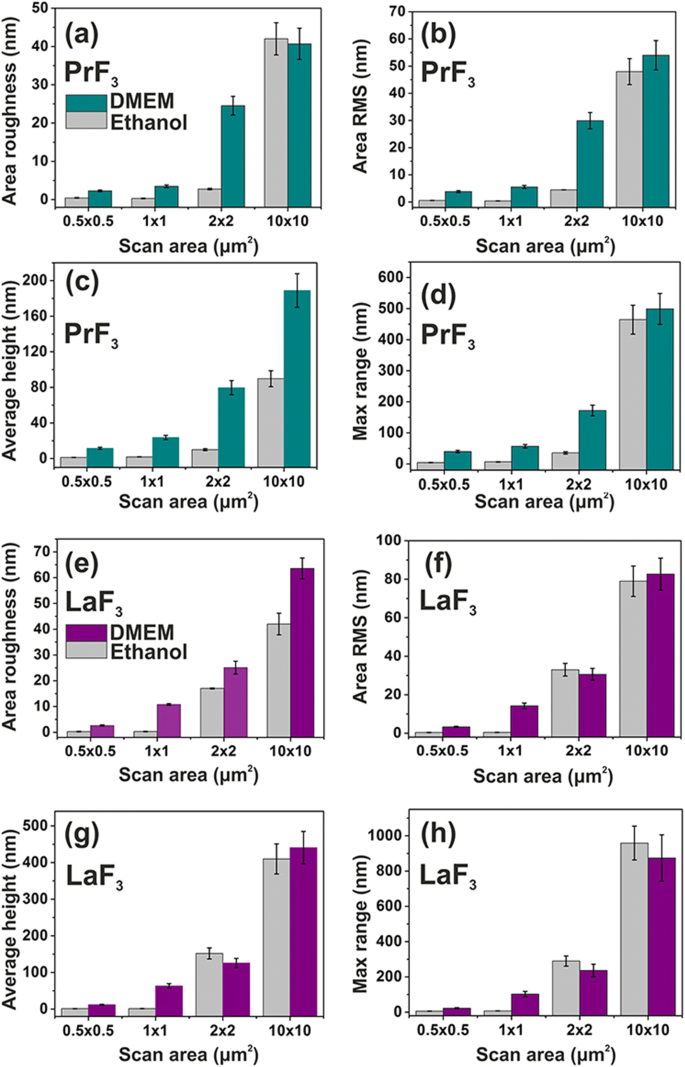
Histogramas de parâmetros de superfície (altura z) de PrF 3 e LaF 3 RE-NPs em um substrato de vidro em DMEM + FBS e etanol para diferentes áreas de digitalização. a , e Rugosidade da área. b , f Área RMS. c , g Altura média. d , h Máximo z -alcance
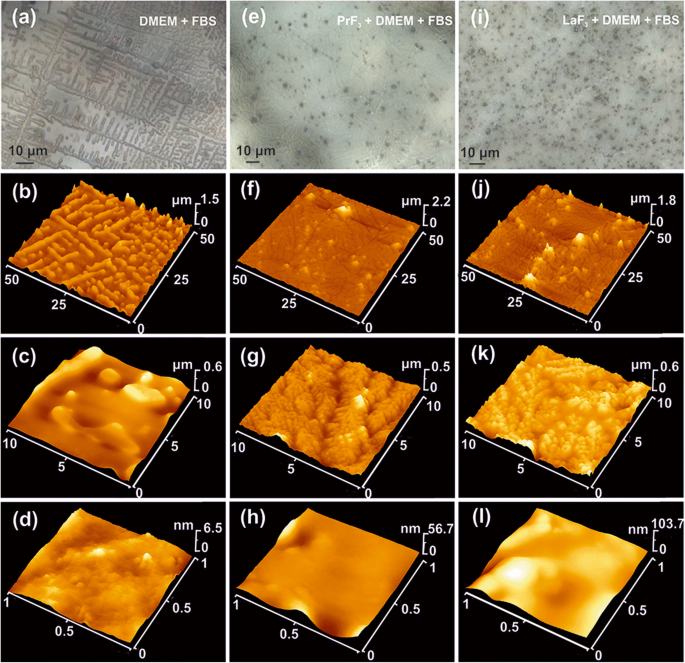
AFM e imagens ópticas de RE-NPs secos em DMEM + FBS. a - d Ótico ( a ) e imagens AFM ( b - d ) de DMEM + FBS mostrando estruturas automontadas de 5 μm. e - h CCD ( e ) e imagens AFM ( f - h ) de PrF 3 NPs em meio DMEM + FBS mostrando estruturas automontadas de dendrita de 500 nm. eu - l CCD ( i ) e imagens AFM em diferentes ampliações ( j - l ) de LaF 3 NPs em DMEM + FBS mostrando estruturas automontadas de dendrita de 100 nm
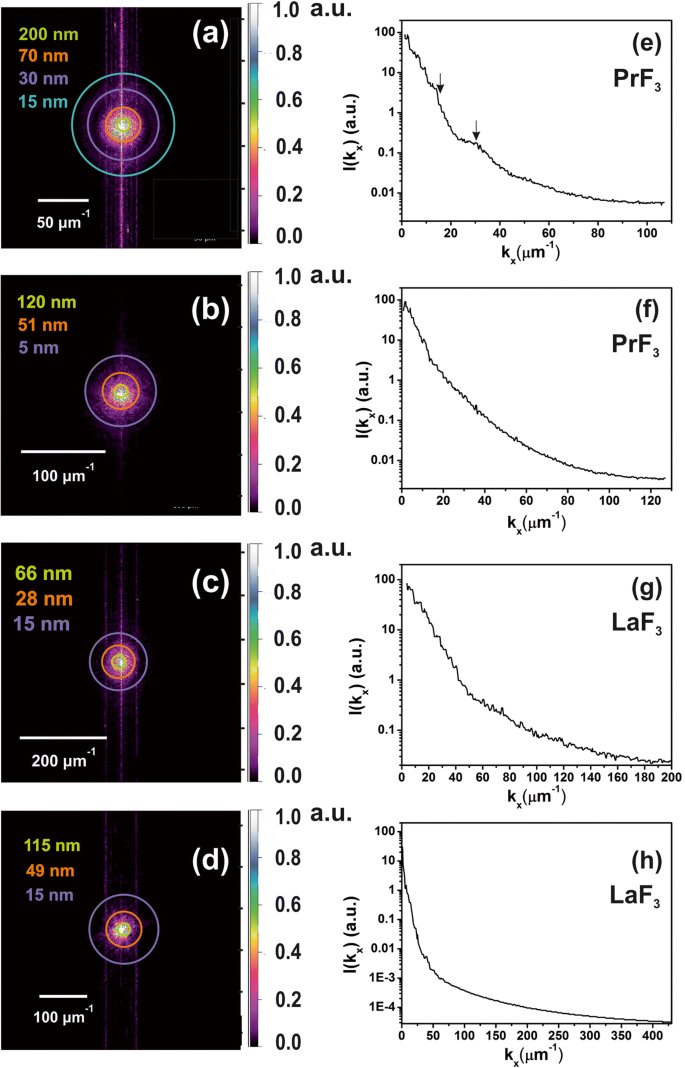
Espectros 2D-FFT de z - distribuição em altura de RE-NPs secos em meio DMEM + FBS evidenciando a presença de NPs de pequeno tamanho nas suspensões líquidas. a , b distribuição de altura z de PrF 3 NPs de imagens AFM, Fig. 2 (a1, b1). Pequeno z características de altura (~ 5 nm) foram identificadas em ( b ) c , d distribuição de altura z de LaF 3 NPs de imagens AFM, Fig. 2 (c1, d1). e , f Espectro de potência de z - vetores de onda de altura de PrF 3 NPs ao longo do x -eixo. g , h Espectro de potência de z -altura de vetores de onda de LaF 3 NPs ao longo do x -eixo
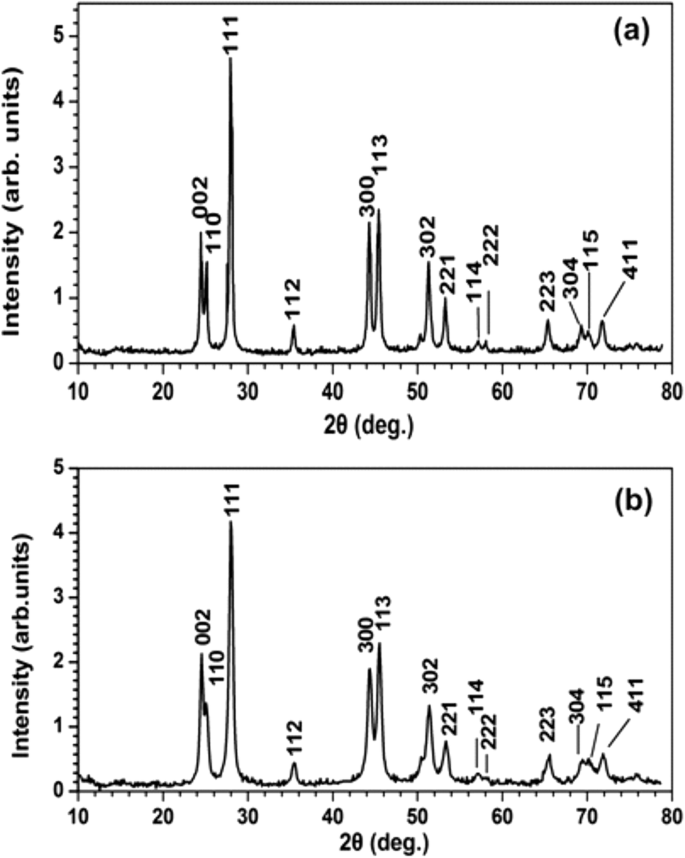
Espectros de XRD de a PrF 3 e b LaF 3 NPs. Os diâmetros médios da área de superfície de PrF 3 e LaF 3 NPs foram ~ 23 ± 4 e ~ 15 ± 4 nm, respectivamente
DLS
Misturas heterogêneas turvas foram inicialmente formadas pela adição de RE-NPs em meios de cultura de células, evidenciando a complexidade das interações entre RE-NPs em suspensões líquidas. Estruturas minúsculas (<10 nm), pequenas (> 10 e <20 nm) e grandes (> 20 nm) de RE-NPs foram identificadas para ambos PrF 3 e LaF 3 solúveis (Fig. 1a-d).
Os valores médios do raio hidrodinâmico (MHR) de grandes RE-NPs (55-83 nm para PrF 3 e 99-296 nm para LaF 3 ) foram rastreados direta e inversamente proporcionais ao nível de concentração de NPs (0,1–10 kg m −3 ) em Eagle's modificados de Dulbecco líquido com soro bovino fetal (DMEM + FBS), Fig. 1g, h. Além disso, o MHR de tamanho pequeno LaF 3 e PrF 3 NPs permaneceram constantes, 10,66 ± 0,74 nm e 10,64 ± 0,40 nm, respectivamente, em diferentes níveis de concentração de RE-NPs. O MHR de RE-NPs permaneceu inalterado por pelo menos 6 dias. Depois de secar as suspensões de RE-NPs, foi impossível dissolver o pó de RE novamente, pois aglomerações de grande tamanho estabilizadas por fortes interações forçaram a precipitação.
Imagens de AFM e TEM de RE-NPs e análise de superfície
Para uma distribuição de tamanho confiável e estatísticas de RE-NPs de pequeno porte em DMEM + FBS a 0,1 kg m −3 AFM (áreas de varredura 1 × 1 e 2 × 2 μm 2 ) e imagens TEM também foram aplicadas (Fig. 2 (a1 – d1) e Fig. 3 (a1, b1)). Depois de transferir as gotas líquidas dos RE-NPs em DMEM + FBS para o substrato de vidro, um número relativamente grande de minúsculos RE-NPs não agregados foi identificado [38] tanto do tamanho médio quanto do diâmetro médio de Feret dos NPs ( Fig. 2 (a2 – d2, a3 – d3) e Fig. 3 (a2, b2, a3, b3)). Além disso, os histogramas da distribuição do ângulo dos diâmetros AFM e TEM Feret (para a dimensão maior dos NPs) indicaram que ambos os RE-NPs foram orientados preferencialmente ao longo de duas direções entre ± (44-62 o ), em relação ao x -eixo (Fig. 2 (a4 – d4) e Fig. 3 (a4, b4)).
Apesar disso z -a distribuição de altura de NPs não forneceu qualquer informação direta sobre a distribuição geral de tamanho de NPs, é uma ferramenta comparativa útil para a primeira estimativa de ( x , y ) distribuição de tamanho porque a altura z e ( x , y ) as distribuições permanecem inter-relacionadas [38].
Os parâmetros médios de superfície de ambos PrF 3 e LaF 3 em suspensões secas para diferentes áreas de varredura AFM também são mostradas na Fig. 4. O pequeno z os valores de altura indicaram um z muito uniforme - distribuição de altura de ambos RE-NPs para 1 × 1 μm pequeno 2 digitalizar áreas. Ao contrário, para RE-NPs e áreas de varredura maiores, o z a distribuição de altura foi significativamente mais ampla. O baixo z Os valores de distribuição de altura em pequenas áreas de varredura refletem a presença de RE-NPs de pequeno porte nas suspensões líquidas. Os valores dos parâmetros de superfície no meio DMEM + FBS foram em média maiores do que no etanol, mostrando um estado reativo complexo entre proteínas e RE-NPs, de acordo com a estruturação multifacetada da Fig. 5 e os dados 2D-FFT (Fig. 6 ) No geral, LaF 3 NPs exibiram uma resposta intrigante em suspensões secas e parâmetros de rugosidade de superfície mais extensos do que PrF 3 NPs.
FFT
Anéis coloridos foram adicionados em raios selecionados nos espectros 2D-FFT (Fig. 6a-d). Os ciclos representam diferentes distribuições de tamanho de NPs no espaço euclidiano, de um tamanho minúsculo igual ao tamanho de um pixel (1,9-3,9 nm) a um tamanho considerável de ~ 2 μm, que era o limite superior de varredura da ponta de AFM no z -eixo (Fig. 6e-h). Um deconvoluído do z os valores de altura com o raio da ponta do AFM fornecem uma resolução real no z distribuição de altura de ~ 5 nm. Os espectros 2D-FFT demonstraram uma distribuição intensa de vetores de onda perto do centro, devido a uma média z -altura de RE-NPs de ~ 44 nm. Os padrões FFT exibiram uma estrutura de halo, que é manchada gradualmente, por causa de uma estrutura de tamanho minúsculo ampla polidispersa identificada nos espectros 2D-FFT. Como apenas o halo apareceu no espectro sem quaisquer padrões difrativos para ambos os espectros 2D-FFT, estruturas regulares automontadas estavam ausentes. Os comprimentos de correlação característicos obtidos a partir dos padrões 2D-FFT semelhantes a anel de PrF 3 e LaF 3 foram ~ 51, 70 nm e 28, 49 nm, respectivamente, de acordo com os valores de MHR extraídos dos espectros DLS.
XRD
A espectroscopia de XRD caracterizou a estrutura cristalina e forneceu informações complementares sobre o tamanho do PrF 3 e LaF 3 NPs (Fig. 7). Os picos de difração acentuados, correspondentes à estrutura de fase hexagonal padrão para ambos os RE-NPs, revelam um alto estado cristalino das fases de aglomeração. Usando a fórmula de Scherrer (\ (\ tau =\ frac {0.9 \ lambda} {\ beta \ cos \ left (\ theta \ right)} \ Big) \), a média do diâmetro do círculo da área igual (MEAC) τ de PrF 3 e LaF 3 NPs foram estimados em ~ 23 ± 4 e ~ 15 ± 4 nm, respectivamente.
Espectroscopia VUV
O espectro de transmissão VUV do PrF higroscópico 3 Camada NPs depositada em CaF 2 substrato, de 125 nm (~ 10 eV) a 190 nm (~ 6,5 eV) é mostrado na Fig. 8. Os picos de VUV em 140-170 nm anteriormente atribuídos às transições de Pr 3+ íons trivalentes do solo 4f configuração de estado eletrônico para os componentes Stark do 4f5d configuração eletrônica dentro de YF 3 , LaF 3 , KY 3 F 10 e LiLuF 4 matriz de cristal único e eles são sobrepostos por uma banda de absorção de VUV de água, revelando a presença de moléculas de água ligadas no PrF 3 e LaF 3 cristais.
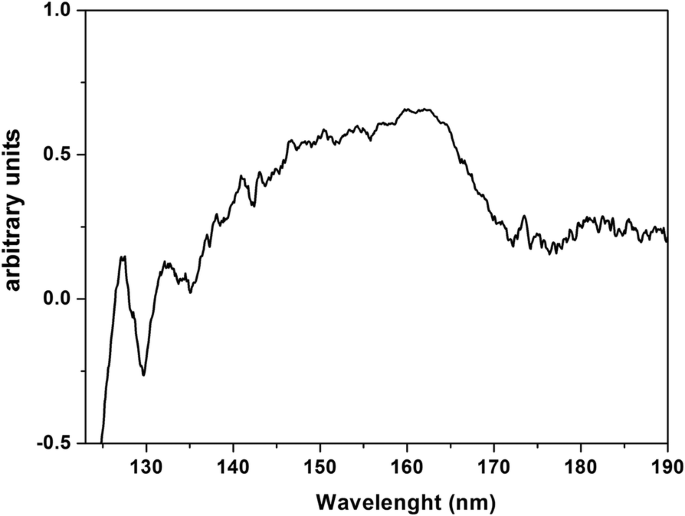
Espectro de transmissão VUV de PrF 3 NPs em suspensões de água depositadas no CaF 2 seco substrato. O espectro indica ligação e retenção de água dentro do PrF 3 NPs
Teste de Viabilidade
Seguindo a análise de distribuição de tamanho e estatísticas de RE-NPs, o teste de viabilidade de sais de tetrazólio solúveis em água (WST) foi usado para monitorar a toxicidade de PrF 3 e LaF 3 NPs para três linhas de células de câncer humano, o A549 derivado de câncer de pulmão, SW837 derivado de câncer de cólon e MCF7 derivado de câncer de mama. Foram utilizadas três concentrações diferentes de suspensões RE-NPs (0,5, 1 e 5 mM) em DMEM + FBS (A549, SW837) e meio Roswell Park Memorial Institute com Fetal Bovin Serum (RPMI + FBS) (MCF7). As linhas celulares foram inicialmente colocadas em placas de 96 poços, deixadas para anexar durante a noite. Para estar dentro da região linear de crescimento celular e para evitar a saturação (Fig. 9a) um dia depois, meio fresco contendo PrF 3 e LaF 3 suspensões foram adicionadas, e os testes de viabilidade foram realizados 24 e 48 h após a adição de RE-NPs, ou 48 e 72 h após o momento inicial do plaqueamento celular. No entanto, para as três concentrações e as três linhagens celulares de cultura, foi detectada uma diferença de supercrescimento, desde que o meio não fosse substituído e não fossem adicionados RE-NPs adicionais na cultura, práticas que alteram as condições iniciais do experimento. Além disso, era impossível plaquear uma concentração de células inferior a ~ 5 × 10 4 células por poço porque a confluência para as três linhas de células era muito pequena para garantir um crescimento celular mensurável. A configuração experimental ideal foi configurada para ~ 5 × 10 4 células por poço.
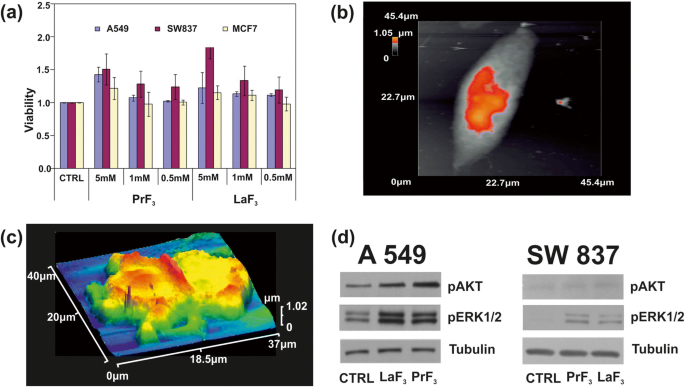
a Histogramas de ensaio de viabilidade WST de três diferentes linhagens de células cancerosas (A549, SW837, MCF7) tratadas com diferentes concentrações de PrF 3 e LaF 3 NPs em meios biológicos. b Imagem AFM de uma única célula cancerosa A549. c Imagem AFM de uma célula cancerosa A549 dividida em RE-NPs em DMEM + FMS. d Análise de fosforilação Wb das células A549, SW837 com as vias AKT e ERK
Em concentração mais elevada (5 mM), para ambas as suspensões de RE, foi obtido um crescimento ascendente para todas as linhas de células (Fig. 9b, c). Entre eles, o maior valor de crescimento foi para a linha SW837 (86%, LaF 3 ) Menos pronunciado, mas ainda relevante, um supercrescimento celular (15%) foi observado para a linha celular MCF7 a 5 mM. A t teste de análise estatística ( p e Fisher F valores) das viabilidades das células tumorais mostraram que o crescimento das células tumorais não estava saturado às 24 h; seguiu uma lei física desconhecida conectando viabilidade e concentração de RE-NPs (arquivo adicional 1).
Ensaios de Fosforilação
O estado de fosforilação de duas proteínas também foi testado (Fig. 9d). Usando anticorpos específicos e ensaios Wb nas linhas celulares A549 e SW837 cresceram em DMEM + FBS com 5 mM de LaF 3 e PrF 3 NPs por 24 h, alta atividade de fosforilação de ERK1 / 2 e AKT em células tratadas, em comparação com células de controle (CTRL), foi obtida.
Discussão
A taxa de crescimento relativo das células cancerosas estava ascendendo em níveis de concentração mais elevados de ambos os RE-NPs (Fig. 9a). No entanto, os valores de MHR de RE-NPs em DMEM + FBS foram rastreados diretamente (PrF 3 ) e inversamente proporcional (LaF 3 ) para a concentração de RE-NPs de 0,1–10 kg m −3 (Fig. 1g, h). Portanto, RE-NPs com tamanho médio acima de ~ 55 nm não devem ter nenhum efeito no crescimento celular e apenas NPs de tamanho minúsculo podem ter um papel real no crescimento do tumor.
Tamanho e estrutura de RE-NPs
Identificação de minúsculos RE-NPs
Dos dados experimentais, extraiu-se o tamanho médio, a distribuição e os parâmetros estatísticos dos RE-NPs. Ao aplicar t testar estatísticas para a "hipótese nula" de "círculo de área igual média" de NPs em PrF seco 3 e suspensões DMEM + FBS, o p valor do diâmetro de NPs entre duas imagens AFM selecionadas aleatoriamente foi ~ 0,001 (arquivo adicional 2). Um valor de diâmetro MEAC (63 nm) foi extraído com confiança dos dados AFM, e isso foi comparável com o valor MHR dos dados DLS (Fig. 1g).
Pelo contrário, o valor do diâmetro MEAC de LaF selecionado aleatoriamente 3 as amostras mostraram um diâmetro médio de MEAC de 26 nm com um valor de probabilidade de rejeição mais alto ( p =0,07), apontando para um comportamento divergente de LaF 3 em suspensões líquidas. A discrepância entre o diâmetro MEAC e o MHR de DLS (296 nm) (Fig. 1) é devido à complexidade das interações em LaF 3 suspensões novamente. Na verdade, para um 2 × 2 μm 2 Área de digitalização da ponta do AFM, a média z -altura era ~ 140 nm, exibindo a presença de tamanho grande LaF 3 NPs, transferidos das suspensões líquidas no substrato (Fig. 4). Para a "hipótese nula" de "valores iguais de diâmetro MEAC de amostras TEM selecionadas aleatoriamente", o p os valores também eram pequenos ( p =0,001). Para ambos os RE-NPs, os valores médios de diâmetro MEAC extraídos dos dados combinados de TEM e XRD para ambos PrF 3 e LaF 3 indicado alto p valores, p =0,29 e 0,06, respectivamente, não permitindo, portanto, qualquer correlação entre os dados TEM e XRD. Apenas TEM, AFM (PrF 3 ) e os dados DLS eram suficientemente confiáveis para extrair o diâmetro MEAC e os valores do núcleo-casca (arquivo adicional 2).
Além disso, uma distribuição de ângulo não isotrópico dos diâmetros de Feret indicou que ambos PrF 3 e LaF 3 as estruturas eram dielétricos altamente polarizados, pois a distribuição do ângulo anisotrópico é uma indicação de fortes interações elétricas polares entre os nanocristais. Um estado polarizado diverso de LaF 3 foi responsável por diminuir a eficiência relativa do estado de aglomeração em suspensões e aumentar os parâmetros de rugosidade da superfície em amostras secas.
Uma análise de partícula de software de imagens aleatórias de AFM para 5 μL e uma concentração de 0,1 kg m −3 identificou um número de ~ 22 e ~ 11 RE-NPs com tamanho menor que 15 nm e 10 nm ( p =0,001), respectivamente, e um número de ~ 60 RE-NPs de imagens TEM ( p =0,001) em uma área de ~ 4 μm 2 , confirmando assim a presença de RE-NPs de tamanho minúsculo nas suspensões (Fig. 3 (c), Arquivo adicional 2) não detectado com DLS.
Estrutura e geometria de RE-NPs
A distribuição de tamanho de RE-NPs é divergente em suspensões de etanol e DMEM + FBS (Fig. 4). A diversidade é devida a diferentes interações moleculares entre as proteínas adsorvidas, carboidratos, eletrólitos e a superfície de RE-NPs, levando à formação de mantos orgânicos altamente complexos (corona), que modulam as interações específicas de RE-NPs 'com células em Meio DMEM + FBS.
A interação entre as moléculas de água presas em RE-NPs higroscópicos e DMEM + FBS também foi vital para a formação do núcleo-concha. Ele também teve um efeito profundo nas proteínas e mudanças conformacionais nas interações entre durante a fase inicial de preparação. Como a razão superfície-volume de NPs desenvolveu altos valores nas suspensões, a estabilidade efetiva e as propriedades físico-químicas, mecânicas e de fluxo de RE-NPs, incluindo a capacidade de absorver proteínas, foram excessivamente variadas [39,40,41] .
A distribuição de tamanho comparativa de RE-NPs em líquido (DLS) e suspensões solidificadas via AFM e TEM mostrou que RE-NPs foram encapsulados dentro de formas orgânicas formando estruturas dielétricas núcleo-concha, onde uma concha proteica circunda o RE-núcleo. As imagens de AFM obtidas a partir de RE-NPs solidificados em suspensões de DMEM + FBS depositadas em substratos de vidro também apontam para a formação de RE-NPs multifacetados e complexos de proteína corona (Fig. 5). Enquanto a mídia seca formou um padrão regular auto-montado de estruturas cristalinas (Fig. 5a-d), as suspensões RE-NPs secas mostraram uma estrutura amorfa em camadas com vários pontos pretos, visíveis mesmo com a câmera digital AFM (Fig. 5e-l) . Em maior ampliação óptica, aglomerações discretas de formas globulares, menores do que aquelas no meio sozinho, também foram detectadas para ambos RE-NPs em DMEM + FBS, juntamente com estruturas do tipo dendrito, ambos mostrando a complexidade das interações, de acordo com o resultados de parâmetros de superfície (Fig. 4). Mesmo com a resolução AFM mais alta (1 × 1 μm 2 área), a última faixa da Fig. 5, nenhuma agregação isolada de RE-NPs, dentro do limite de resolução de ~ 5 nm, foi identificada em estruturas secas para ambos os RE-NPs. Os micélios esféricos de cor preta, com 1–2 µm de comprimento, mostrados nas imagens ópticas, eram grandes formações aglomerantes de RE-NPs núcleo-casca. A complexidade das reações entre os RE-NPs e DMEM + FBS foi visualizada através da transformação das estruturas alongadas auto-montadas de longo prazo em DMEM + FBS puro em estruturas dendríticas.
Os resultados apontam para a imagem de uma única estrutura de núcleo RE-NP encapsulada dentro de uma casca de proteína. Essas estruturas eram indetectáveis porque estavam rodeadas por matéria orgânica e eletrólitos, ambos com reação cruzada com RE-NPs. O espectro VUV de PrF 3 mostra alguns picos espectrais entre 140 e 170 nm (Fig. 8). As transições iônicas são sobrepostas por uma banda de absorção de água VUV estendida de 145 a 180 nm com um máximo a 168 nm. Apenas as assinaturas espectrais do 4f6s configuração eletrônica com maxima a 132 e 127 nm estavam presentes no espectro. No entanto, essas bandas podem evidenciar a presença de água no PrF altamente higroscópico 3 suspensões. Water has a rich, structured absorption band in the VUV spectral range centred at 122 nm, revealing the presence of water molecules in the core-shell NPs.
Activation of Mechanosensors
Activation of Integrins by External Forces
The activation of oncogenic pathways by RE-NPs [24], besides the 3D structural nature of TSRs, is based on some Natural Evolution principles for sustaining the viability of cells. First, upon binding a specific external ligand in a LABS, conformational changes along the entire TSR spectrum underline a series of cascading pathways, triggering tumour cell growth (Fig. 9c, d). The transmission of signals advances through the plasma membrane via various protein chains. Signal transduction was via conformational transformations of integrins responding to a high affinity external force (Fig. 10a, b).

Simplified layout of integrin activation by NPs and signal transaction pathways. a Structure and conformational geometries of integrins at a low (A), medium (B) and high-affinity strengths (C). b AKT and ERK1/2 signal transaction pathways activated by RE-NPs via external integrin stimulation
Because of “life sustainability” and “survival laws” that prevents cancer cell growth by random “noise”, it is required that the strength of the external force should be within a bounded range of values and also the external strength stimulus should apply for a long period on a large number of mechanosensors in a cancer cell. The external strength that stimulates cancer must be slightly larger than the strength of the interatomic molecular forces under normal conditions. For a thermal energy of a ligand at room temperature (kT = 0.025 eV, T = 298 K), and for a regular thermal stress of molecular bonds of ~ 0.05 nm, the mean thermal force acting on the LABS stays for 1.2 × 10 −12 N. In principle, a force above ~ 10 × 10 −12 N acting coherently on the whole set of mechanosensors on a cell should activate signal transduction in tumour cells. Consequently, ignoring any thermal and mechanical stressing in the ECM normal conditions, integrin activation via electrical polar interactions between LABS and NPs has the potency to start signal transduction in cancer cells and to initiate tumorigenesis.
Integrin Structure and Geometry
An integrin receptor in the upright conformation state extends ∼ 20 nm upwards from the cell membrane [42] (Fig. 10a). For no contacts between the two α- and β-subunits, other than those in the headpiece near the ligand-binding pocket, the α- and β-subunits are well separated with their cytoplasmic tails extended out up to ∼ 8 nm [42]. A conic projection geometry (20 nm slant height, 5–10 nm diameter of its circular base), bounded by the α- and β-subunits, defines a projected area on the surface of cell’s membrane between ~ 19 and ~ 80 nm 2 , for a typical mean radius of a tumour cell R c ≈ 5 μm (equivalent surface area of a spherical cell \( {S}_c=4\pi {R}_c^2=3.14\ \mathrm{x}\ {10}^8\ {\mathrm{nm}}^2 \)). By dividing the area S c of a spherical tumour cell surface with the projected area of an integrin on a cell surface, an upper limit of the number of integrin receptors for these projected areas was n int = 1.6 x 10 7 and 3.9 × 10 6 respectivamente. These numbers are compared with the mean number of integrins on a cell \( {\overline{N}}_{int}\approx 2\ \mathrm{x}\ {10}^5 \) and for an average interspacing of 45 nm between adjacent integrin receptors [43]. Nevertheless, \( {\overline{N}}_{int} \) might be larger because of an uneven surface structure, different separating distances between integrins and variable size of tumour cells (Fig. 9c), but the number of integrins on a cell membrane stand between n int and \( {\overline{N}}_{int} \).
Interaction of Mechanosensors with RE-NPs
ERK ½ and AKT Activation
The TEM images and the elemental mapping of F, La and Pr showed that RE-NPs were unable to penetrate inside the cell. They gathered around the A549 cell membrane (Fig. 11), confirming that an external force can stimulate cell growth because of TSRs activation [44]. The Pr atoms were distributed around the boundaries of the cell’s membrane. The small numbers of F, La and Pr identifications inside the cell were not associated with endocytosis of RE-NPs, but they were images of RE-NPs from the projections of the two cells hemispheres on cell’s equatorial cycle.

TEM images and elemental analysis of RE-NPs at the surface boundaries of A549 cells. a TEM image of small size LaF3 NPs surrounding the A549 cells. b Elemental analysis of F atoms in RE-NPs distributed around the cell. c Elemental analysis of La atoms. The low concentration of La atoms was associated with a rather small scattering efficiency of the X-rays. d - f The same as for (a - c ) for PrF3 RE-NPs
It was also evident that both RE-NPs were able to enhance AKT phosphorylation, especially in A549 cells (Fig. 9d), where the steady-state level of AKT pathway activity was higher for the SW837 cell line. The phosphorylation level for the MCF7 cell line was below the detection limit, in agreement with the relatively low levels of growth. High phosphorylation levels of ERK1/2 [36] and AKT were detected in A549 and SW837 cell lines. Cell growth was started once NPs with a proper size interact with the mechanosensors of the cells to provide the correct force for initiating cell growth [45, 46]. ERK and AKT pathways were frequently active in several cancer cell types via extracellular springing, as they were stimulated by the TSRs, upon a selective binding with various mitogenic ligands, or via the activation of the mechanosensory group. The interaction was responsible for a continuous intracellular stimulation that, according to the cell’s phenotype, driven the cancer cells to uncontrolled and endless growth. Viability tests were also run for 48 and 72 h, but the growth of all cell lines was saturated at 48 and 72 h after the initial moment of Cell plating.
Interaction of Cells with Ions
Likewise, as fluoride anions are the most reactive electronegative elements and, the mean radii extension of the unscreened 4f electronic configuration of La and Pr trivalent ions are relatively large, high electric surface charges could be developed via electric dipole interactions [47].
One crucial question stands whether a single ion binding on a specific site can activate tumour cell growth. Because the projected area of the 4f electronic configuration of a single RE ion is S 4f = 0.040 and 0.043 nm 2 (for an approximated spherical geometry of the 4f electronic configuration and a 4f mean orbital radii ~ r 4f =0.113 and 0.117 nm for Pr and La ions, respectively), a typical upper limit number of single RE ions, or other equivalent size ions, over the whole area of the cell membrane was ~ Sc / S 4f = N 4f ~7.9 × 10 9 RE ions; a number which is at least two orders of magnitude above the upper limit of the mean number of integrins on a tumour cell. As the relative overgrowth of cells was ascending with rising concentration (Fig. 9a), it is unlikely that tumour cell growth is triggered by a specific binding of single trivalent RE ions [48] on the ligand sites [49,50,51]. Indeed, the large number of RE ions should have saturated the cell’s growth and thus the viability of cells should have remain independent from the concentration of the RE ions.
Interaction of Integrins with RE-NPs
Within the requisite force range of few pN, and for efficient activation of integrins from NPs, the interaction between NPs and LABS should activate a large fraction of integrins of the cell for a long time. In the most extreme favoured case for cell growth, the number of NPs had to remain equal with the number of integrins on the cell’s surface, and the interactive force between LABS and NPs has to be attractive for obtaining a constant (long-term) action. A thin spherical shell of spherical NPs surrounding a tumour cell occupied a volume\( {V}_{sc}\approx 4\uppi {R}_c^2x \), where R c = 5 μm is the cell radius and x ≈ 20 nm is half the separating distance between adjacent integrin receptors and V sc ≈ 6.3 x 10 9 nm 3 . For justifying the requirement that each integrin receptor interacts only with one NP, a first estimation of the size of NPs to meet the above requirements for the whole set of integrins on a cell is obtained by dividing the volume of the spherical shell V sc with the number of integrins. A simple calculation for a cell radius 5 μm shows that the limits of radii of NPs activating the whole set of integrins within the spherical shell volume V sc ≈ 6.3 x 10 9 nm 3 covering the cell is obtained by divided the volume V sc with the number of integrins \( {\overline{N}}_{int}\approx 2\ \mathrm{x}\ {10}^5 \) and n int ≈ 1.6 x 10 7 . The volume of the spherical NPs stands for 3.15 × 10 4 and 3.93 × 10 2 nm 3 respectivamente. Therefore, the radii of the NPs interacting with an integrin lay between ~ 20 and 5 nm. Allowing for one order of magnitude variations in the number of integrins \( {\overline{N}}_{int} \), the radii of the NPs interacting with integrins is between ~ 27 and ~ 3 nm respectively.
By also applying similar simple calculations and within the experimental limits of concentration levels of RE-NPs (0.1–10 kg m −3 ), the maximum numbers of PrF3 with MHR 55–83 nm and LaF3 with MHR 296–100 nm NPs (Fig. 1g, h) covering the surface of a tumour cell V sc stood for 4.1 × 10 4 –2.1 × 10 4 and 17.1 × 10 2 –1.5 × 10 4 NPs. These values are placed well below the number of integrins on the cell surface. For rising concentrations of PrF3 and LaF3 from 0.1 and 10 kg m −3 , the number of PrF3 and LaF3 NPs in the suspensions must go up for either descending or ascending size of NPs. As viabilities of cancer cells are raised at higher concentration levels, it is unlikely that 55–296 nm sized RE-NPs are responsible for cancer cell mitosis under the current experimental configuration.
Also, from the DLS data, the size of both RE-NPs between 10 and 20 nm remained constant (10.6 nm) at different RE concentrations. The number of RE-NPs with this size covering the cell surface is between 3.7 × 10 5 and 1.5 × 10 6 . This number is comparable with the mean number of integrins \( {\overline{N}}_{int}\approx 2\ \mathrm{x}\ {10}^5 \) on a cell surface. Therefore, only small size RE-NPs have the potency to stimulate cancer cell growth by stimulating all the integrins on a cell surface, in agreement with the experimental observations (Figs. 1g, h and 9a).
The number of tiny sizes RE-NPs with MEAC diameter (TEM) from 2 to 10 and 10 to 15 nm on the cell surface (S c = 314 μm 2 ) stands for 1.3 × 10 4 and 1.8 × 10 4 RE-NPs, respectively. Those values stayed one order of magnitude below \( {\overline{N}}_{int}\approx 2\ \mathrm{x}\ {10}^5 \) and therefore tiny size RE-NPs had also the potency to justify the experimental results of rising viability values with concentration (Fig. 9a). Also, the rough surface of tumour cell (Fig. 9c) is able to form cavities, where small size RE-NPs are trapped, triggering thus cell’s mechanosensors. Most important, only tiny size RE-NPs have the potency to activate integrin receptors via electrical dipole interactions (vide infra).
Interaction of EGFR with RE-NPs
An upper limit of small size NPs capable of stimulating cell’s overgrowth via the EGFR was set previously to 14 nm [52], but a realistic size of NPs stimulating the EGFR should be < 5 nm [53] (Fig. 12). The area number density of EGFR on the surface of tumour cells stands for ~ 1.4 × 10 −4 nm −2 and the total number of EGFR on the surface S c of cells remains between ~ 4.2 x 10 4 and 10 5 [54,55,56]. RE-NPs with 5–10 nm size stayed for a number of 34 NPs (Fig. 3). Extrapolating this number to the surface of a cell S c , the total number of RE-NPs remained at ~ 10 4 NPs, a number which matches the number of EGFR receptors on a A549 cell. Therefore, the EGFR have the potency to be activated synergistically also by a number of tiny size RE-NPs.

AKT and ERK1/2 signal transduction pathways activated by RE-NPs via EGFR stimulation. EGFR is activated only by tiny size ~ 5 nm NPs
Electric Dipole Interaction Between RE-NPs and LABS
The above experimental results are supported by the hypothesis of cancer cell growth from LABS stimulation by tiny size core-shell RE-NPs via electrical dipole interactions, Appendix.
Indeed, the mean electrical dipole force \( \left\langle {\overrightarrow{F}}_{V_2}\right\rangle \)acting on LABS from a core-shell RE-NP includes two terms (Fig. 13d and Appendix, Eq. A22). The first radial term is inversely proportional to the forth power of separating distance r 1 between the RE-NPs and LABS and is also proportional to the size of NP. The second polar term is inversely proportional to both the separating distance r 1 and the square power of the size of NP,
$$ \left\langle {\overrightarrow{F}}_{V_2}\right\rangle =-\frac{G_1{N}_2{N}_1\ d{e}^2}{4{\varepsilon}_0\ {r}_1\ }\theta \left(\ 3G\frac{b}{r_1^3}{\widehat{r}}_1+\frac{\theta }{2{b}^2}{\widehat{\theta}}_1\right)\kern0.75em (1) $$

a Electrical dipole interaction between one core-shell RE-NP and one LABS. b , c RE core-shell NP near a MIDAS (b ) and ADMIDAS (c ) adhesion sites. d Locus area (green) of the size of RE-NPs and separating distance between a LABS and a core-shell RE-NP for two electrical charging states
Na Eq. 1, G e G 1 are the geometrical factors of NPs, describing either core-shell or core spherical structures, Appendix, Eqs. A6 and A14; N 1 , N 2 are the numbers of surface electrons on the a RE-NPs and LABS surfaces; d e b are the effective characteristic spatial extension of atomic orbitals of LABS, ~ 0.1 nm, and the radius of RE-NP; e e ε 0 are the electron charge and the vacuum permittivity and \( \theta =\frac{d}{r_1}<0.01\ rad \). Because the core of the RE-NPs is a crystalline semiconductive material, an inherent large number of surface and volume defective sites were accountable for a high density of pseudo-electron energy levels that allowed the electrons to move freely within the core volume [46]. Consequently, a core-shell structure had the potency to be highly polarised. Therefore, LABS can be activated efficiently by core-shell RE-NPs via electrical dipole interactions at close separating distances. The high polarised efficiency of the core nucleus was confirmed experimentally via the selective orientation of NPs along two distinct directions (Fig. 2(a4–d4) and Fig. 3(a4, b4)).
The polar interaction force is also proportional to the geometrical factor G 1 , Appendix, Eq. A14. Typical values of dielectric constants of the culture media, shell configuration and RE core components stand for ε 1 = 78, ε 2 = 10 and ε 3 = 15. When the ratio of core-shell to core radii b/a sets within 1 and 50, the geometrical factors G , G 1 retain almost constant values (G = 0.2, G 1 = 0.01) and they are self-same for both a spherical core (b/a = 1) and a spherical core-shell. Any permanent or induced polarisation of an open or closed a-I-MIDAS domain forming the LABS domain has its origin on six coordinated water oxygen atomic orbitals with Mn 2+ or Mg 2+ ions, arranged in a spherical geometric configuration [7] (Fig. 12a–c).
As the electrical dipole force in Eq. 1 stands for the vector sum of a radial (first term) and a polar component (second term), the last term prevails over the first one provided that
$$ {r}_1>\sqrt[3]{6G}b\sim b\kern0.75em (2) $$
In this case, a LABS is activated from the polar force component for all (b/a) ratios and, most important this term is inversely proportional to the second power of the size of NPs, in agreement with the experimental results that only tiny or small size LaF3 NPs activated cancer cell proliferation.
The prevailed polar force term for different r 1 e b values and for different Ν 1 , Ν 2 charging states activating the LABS/MIDAS stay within the limits [57,58,59,60].
$$ {10}^{-12}N<\frac{G_1{N}_2{N}_1\ d{e}^2}{8{\varepsilon}_0\ {r}_1{b}^2\ }{\theta}^2<{10}^{-9}N\kern1em (3) $$
Inequality 3 relates the size b of the RE core-shell NPs, the separating distance r 1 and the number of the bound or free electrons Ν 2 , Ν 1 on the surface of the two dipoles. The locus of points (r 1 , b ) satisfying the inequality 3 for different surface charge states Ν 1 , Ν 2 is bounded by the black, red and blue lines (Fig. 13c). As there was no specific assumptions for the type of RE-NP, results can be equally applied for any type of polarised NPs.
When the algebraic product of the number of the surface electrons N 1 e N 2 (bound or free) on the LABS and the RE-NP, respectively, was N 1 N 2 = 2, the locus of RE-NPs size and separating distance for integrin activation was < 1 nm. At higher charging states, N 1 N 2 = 10 4 , the locus area spans a wider RE-NPs size and separating distance area set of values, from 0.5 nm–19 nm to 2.5–15 nm, respectively.
From the above analysis, it is found that only tiny or small size NPs can activate LABS at a certain separating distance r 1 and the electrical dipole interaction strength decays inversely proportional to the second power of the size of NPs. From Fig. 13c and for a charging state with N 1 N 2 = 5 x 10 4 , the size of NPs capable to activate LABS is bounded by the limits
$$ 2.5\ \mathrm{nm}
Conclusions
Cancer is a complex disease. Tumours are highly heterogeneous, and cell growth, among other factors, depends on dynamical interactions between cells and the continually changing extracellular matrix. Besides random genomic mutations, signal transductions in cells, activating cell growth can be triggered by mechanical, thermodynamic and electrical polar interactions between the microenvironment of the extracellular cell matrix and the membrane’s mechanosensors. Here, we demonstrated that tumour cell proliferation in three different human cancer cell lines (A549, SW837, MCF7) had the potency to be activated by a synchronised and synergetic activation of EGFR or via electrical dipole interactions between tiny size RE-NPs and the LABS of integrins on a cell.
Because the prerequisite force for integrin activation should stand between 10 −12 and 10 −9 N, the size of the active RE-NPs causing cell growth should be within certain limits. Cancer activation is specified by both the electrical surface charges on the LABS and the NPs and by their separating distance. This electric dipole activating force follows an inversely proportional square power law of the radius of NPs, evidencing that only tiny or small size RE-NPs have the potency to stimulate cancer cell growth via electrical dipole interactions, in agreement with the experimental results.
Methods
Synthesis of RE-NPs
PrF3 NPs were synthesised via co-precipitation. Briefly, 4 g of Pr2 O 3 were added to 110 mL of 10% nitric acid in a polypropylene glass beaker together with 3 g of NaF under stirring. The mixture was heated to 50 °С and stirred for 45 min until a clear light-green solution appeared. Then it was filtered. The pH of the mixture adjusted to 4 by adding 25% of ammonium hydrate. Next, the mixture was stirred again for 20 min. Finally, the precipitated NPs washed with distilled water by centrifugation.
LaF3 NPs were also synthesised by applying the same protocol in a mixture of La2 O 3 (4 g) and NaF (3 g). From both preparations, an aliquot of the suspensions containing NPs was air-dried for structural analysis and the remaining part kept as water suspension for the biological studies.
The suspensions of NPs were prepared in complete DMEM+FBS cell culture medium by adding water suspended NPs directly to the medium to a final concentration of 5 mM. Then, starting from the 5 mM stock solution, some subsequent dilutions using DMEM as a solvent were prepared to a final NPs concentration of 1 mM and 0.5 mM, respectively.
Size Distribution of RE-NPs
XRD
The crystal structure and the size of PrF3 and LaF3 NPs were characterised by XRD spectroscopy, with an X-ray diffractometer (Shimadzu XRD-7000S) in the 2θ range from 10° to 80° using the graphite monochromatised Cu-Ka radiation (1.5406 Å). The weighted average of τ for all peaks was used in the statistics. Weighting, besides β, took into account the relative intensity of every peak of the XRD spectra. The corresponding errors incorporate the reading error (0.3 mrad) and the standard error of the mean (se = σ / √ Ν )
DLS
The size distribution and the MHR of RE-NPs in water and DMEM+FBS suspension were determined for comparison by DLS at 632.8 nm and right angles at 37 °C with a multi-angle dynamic and static light scattering instrument (PHOTOCOR-FC). The values of the MHR (Stokes radius) and the size distribution of NPs were calculated from the autocorrelation spectra and the Stokes-Einstein relation with the DynaLS software. Because the intensity of scattered light in pure DMEM+FBS was 20 times lower than with RE-NPs additives, the level of aggregating proteins in pure DMEM+FBS was negligible compared with mixed suspensions of RE-NPs in DMEM+FBS medium. MHR and RE-NPs size distribution and size errors were obtained by fitting and processing the data from the DLS instrument with the DynaLS software that allows the MHR to be calculated in different spectral domains of the main size distributions, from 10–10 2 to 10 2 –10 3 nm, Additional file 2.
AFM
Because size distribution below 15 nm was close to the low limit range of DLS, AFM was also applied to evaluate small size distribution. At low concentration of RE-NPs in liquid suspensions and slow drying rates of droplets on glass substrates, the deposits reflected the size distribution in the liquid suspensions [37]. Following the dispersion of RE-NPs in ethanol or DMEM+FBS, a drop of suspension was placed on a clean glass substrate using a micropipette, and then it was dried in air at room temperature for AFM imaging and analysis (diInnova, Bruker). AFM was performed in the tapping mode, in ambient conditions with a phosphorus-(n)-doped silicon cantilever (Bruker, RTESPA-CP), having a nominal spring constant of 40 nN/nm and operating at a resonance frequency of 300 kHz. Surface areas of various sizes (0.5 × 0.5–50 × 50 μm 2 ) were imaged with high spatial resolution (512 px × 512 px) at a scanning rate of 0.2 Hz to identify domains with different size distributions via “scan area filtering” [37]. From the morphological analysis by the SPM LabAnalysis V7 software, the particle’s size distribution, shape and aggregation stage were determined.
The size of NPs for different scanning areas was also noticeable by the particle analysis chromatic bar (Fiji integrated ROI colour coder based on MEAC diameter) (Fig. 2(a1–d1)). The AFM image was transformed into a binary image using an appropriate z -height threshold. Every pixel of the processed image contained information not only for the z -height in the pixel area but also for the presence of particles in the pixel area. O x -histograms of MEAC and Ferret diameter (Fig. 2(a2–d2, a3–d3)) were extracted by using the “Image J 1.51n Fiji distribution software”, with the correct z -height threshold values. The size resolution per pixel was 3.9 and 1.9 nm for PrF3 and LaF3 respectivamente.
The particle identification, the noise extraction and the particle area data were processed by the “Particle Analyser function” of Fiji software (Fig. 2(a1–d1)). The particle diameter histograms were also analysed. Both the equal area circle diameter (Fig. 2(a2–d2)) and Feret diameter or “calliper diameter” (maximum diameter of a particle among all directions) (Fig. 2(a3–d3)), whose direction was the Feret angle (Fig. 2(a4–d4)), were analysed. The mean equal area circle diameter and the mean Feret diameter were calculated taking into account all particles identified. The associated errors incorporated the actual pixel size in every AFM image and the standard error of the mean (se = σ / √ Ν )
A t test was performed for every set of AFM images based in the “null hypothesis” that the mean particle diameter was the same for all the AFM images between randomly selected figures (Fig. 2(a1–b1, c1, d1)). O p value (probability that the null hypothesis based on t distribution is not valid) is shown in Additional file 2.
TEM
The same technique was followed for calculating the above parameters in TEM imaging (Fig. 3(a1–b4)). Atomic resolution TEM (Hitachi HT7700 Exalens) imaged either extracellular or intracellular RE-NPs attachment on the A549 cells fixed in glutaraldehyde. Elemental analysis of F, La and Pr were also carried out (Oxford Instruments X-Max 80T).
2D-FFT
Additional information on the NPs size distribution in the (x , y ) plane was also extracted from the 2-D Fourier transform of AFM images of NPs using the relation
$$ I\left({k}_x,{k}_y\ \right)=\iint f\left(x,y\right)\exp \left(i{k}_xx\right)\exp \left(i{k}_yy\right) dxdy $$
onde f ( x , y ) is a size function at a point (x, y ), k x , k y are the associated wavevectors in the inverse Eukledian space at the same point and I ( k x , k y ) is the “spectral density” of the function f ( x , y ) at the point k x , k y . For most applications, f ( x , y ) is the z -height of the NPs at the point (x, y ) and z = f ( x , y )
For a set of discrete data, such as the digitised AFM images, the 2D-FFT was used instead of 2D Fourier transform in the continuous space. For a m × n X-matrix (pixels of an AFM image), the 2D-FFT transform takes the form
$$ \kern1em {Y}_{p+1,q+1}=\sum \limits_{j=0}^{m-1}\sum \limits_{k=0}^{n-1}{\omega}_m^{jp}{\omega}_n^{kq}{X}_{j+1,k+1\kern1.25em } $$
where \( {\omega}_m^{jp}={e}^{2 pi/m},{\omega}_n^{kq}={e}^{2 pi/n} \) are the associated frequencies. Then, an appropriate shift along the y -axis was performed and the integers m, n, p, q, k were translated into lengths and inverse lengths respectively by a multiplication with the pixel’s size of the image.
Water Trapping in RE-NPs
VUV Spectroscopy
To appraise the state of water in RE-NP’s complexes during the initial stage of suspension preparation, the adsorption of water molecules on the surface of the hygroscopic PrF3 NPs was identified with a laboratory-made VUV (110–180 nm) absorption spectrometer. It consists of a hydrogen lamp operating in a longitudinal stabilised discharge mode at 10 kV, a stainless steel vacuum chamber and a VUV monochromator (Acton VM502), equipped with a solar blind photomultiplier (Thorn EMI 9412 CsTe) and a laboratory-made data collection system. Thin layers of PrF3 NPs suspensions in water were prepared and dried on 1-mm-thick VUV-grade CaF2 substrates by applying the “drop-casting method”. Then, the CaF2 substrates were placed in the optical path between the hydrogen lamp and the VUV monochromator in a vacuum. The stainless steel 316 vacuum chamber was evacuated initially to 10 − 7 mbar using two turbomolecular pumps at a differential pumping configuration (Edwards EXT 100/200, pumping speed 150 ls −1 ) However, a high outgassing rate of PrF3 sets an upper limit to the background pressure in the vacuum chamber ~ 8.5 × 10 −5 mbar. The relatively low background pressure of both compounds irreversibly damages the VUV optics and the turbomolecular pump after few hours of operation and therefore it sets certain experimental constraints, preventing an equivalent registration of LaF3 spectrum because of high outgassing rates and a low background operating pressure (< 10 −4 mbar). The experimental data (light transmitted through the sample film on CaF2 window) were fitted to a logarithmic response for calculating the transmittance.
Cell Culture and Growth Assay
Cell Growth
The A549 and SW837 cell lines were maintained in DMEM+FBS, whereas the MCF7 lines were in RPMI+FBS. Both media supplemented with 10% fetal bovine serum (FBS), 1 × penicillin, 1 × streptomycin and 2 mM l-glutamine. Cells were incubated at 37 °C, 5% CO2 in a humidified atmosphere.
The WST viability test was used to monitor the intrinsic toxicity of PrF3 and LaF3 NPs for three human cancer cell lines, A549, SW837 and MCF7. For the viability assay, three different concentrations of RE solubles (0.5, 1 and 5 mM) in DMEM+FBS (A549, SW837) and RPMI+FBS (MCF7) were used. The initial number of cells seeded in the 96-well plates was ~ 5 × 10 4 cells/well. This amount of cells was plated 24 h prior to the RE-NPs treatment of cells in order to allow enough time for the cells to attach properly to the plate (wells) and to attain the optimum growing conditions. Subsequently, the viability test was performed 24 h after RE-NPs addition, or 48 h after the initial cell cultures were placed in the wells. As we did not observe any cell reduction, but on the contrary cell-overgrowth, especially with the SW620 cell line at 5 mM, the cell confluence quickly reached 80–90% of its initial value after 24 h of the addition of RE-NPs or 48 h from the initial plating.
Five microliters of WST solution was added to each well and the plate was incubated for 1 h during the growth state. The absorbance at 450 nm of each well was measured using a microplate reader (Biorad, x Mark). Each experimental point for each cell line and each RE suspension was extracted from two samples and triplicated every 2 days (total of 108 samples).
F test was used for every set of cell viability measurements. Here, the “null hypothesis” was that the relative to the CTRL “mean viability value was the same at different concentrations within the same cell line”. With this null hypothesis, an unknown law connecting tumour cell viability and RE-NPs concentration was identified. O p value (probability the null hypothesis to be rejected) was also tested from the F distribution Additional file 1.
Western Blotting and Antibodies
Total proteins were extracted with 60 μL of radioimmunoprecipitation assay (RIPA) lysis buffer (20 mM Tris-HCl (pH 7.5); 150 mM NaCl, 1 mM Na2 EDTA; 1 mM EGTA; 1% NP-40; 1% sodium deoxycholate; 2.5 mM sodium pyrophosphate; supplemented with proteases inhibitors 1 mM β-glycerophosphate; 1 mM Na3 VO4 1 μg/ml; leupeptin) and the Wb assay was performed according to standard protocols (Fig. 9b). Briefly, total proteins (50 μg) were separated by SDS-polyacrylamide gel electrophoresis (SDS-PAGE) and transferred to nitrocellulose membrane. Blots were incubated overnight at 4 °C with appropriate primary antibodies. The antibodies used were tubulin code sc-8035, from Santa Cruz (final concentration 1:1000 in blocking buffer); p-ERK (E-4) code sc-7383, from Santa Cruz (final concentration 1:500 in blocking buffer); and p-AKT (Thr308) code 9275S, from Cell Signaling (final concentration 1:1000 in blocking buffer).
Wb bands are collected from different blots showing quality control of antibodies specificity. Numbers at the top of the phosphorylation images show grey scale levels from 0 (black) to 168 (grey) (maximum value ), indicating activation at a non-saturated mode.
Abreviações
- 2D-FFT:
-
Two-dimensional fast Fourier transform
- ADMIDAS:
-
Adjacent MIDAS
- AFM:
-
Força atômica microscópica
- AKT:
-
Protein kinase B
- CTRL:
-
Control cells
- DLS:
-
Espalhamento de luz dinâmico
- DMEM:
-
Dulbecco’s modified Eagle’s medium
- ECM:
-
Cell-extracellular matrix
- EGFR:
-
Epidermal growth factor receptors
- ERK:
-
Extracellular signal-regulated kinase
- F.A.:
-
Feret angle
- F.D.:
-
Feret area diameters
- FBS:
-
Soro fetal bovino
- LABS:
-
Ligand adhesion binding site
- MEAC:
-
Mean equal area circle
- MHR:
-
Mean hydrodynamic radius
- MIDAS:
-
Metal ion-dependent adhesion sites
- NGFR:
-
Nerve growth factor receptor
- NP:
-
Nanoparticle
- RE-NPs:
-
Rare-earth nanoparticles
- RIPA:
-
Radioimmunoprecipitation assay
- RMS:
-
Raiz quadrada média
- RPMI:
-
Médium do Roswell Park Memorial Institute
- SDS-PAGE:
-
Sodium dodecyl sulfate-polyacrylamide gel electrophoresis
- SyMBS:
-
Synergistic metal ion binding sites
- TEM:
-
Microscopia eletrônica de transmissão
- TSR:
-
Transmembrane signal receptors
- VEGFR:
-
Fator de crescimento endotelial vascular
- VUV:
-
Vacuum ultraviolet
- Wb:
-
Western blot assays
- WST:
-
Water-soluble tetrazolium salts
- XRD:
-
Difração de raios X
A resposta fotocorrente extremamente aprimorada em nanofolhas isolantes topológicas com alta condutância
Efeito do recozimento pós-térmico nas propriedades ópticas de InP / ZnS Quantum Dot Films
Nanomateriais
- Sobre nanopartículas semicondutoras
- Nanopartículas de FePO4 biocompatíveis:entrega de drogas, estabilização de RNA e atividade funcional
- Estudo in vitro da influência das nanopartículas de Au nas linhas celulares HT29 e SPEV
- Poliglicerol hiper-ramificado modificado como dispersante para controle de tamanho e estabilização de nanopartículas de ouro em hidrocarbonetos
- Promoção do crescimento celular SH-SY5Y por nanopartículas de ouro modificadas com 6-mercaptopurina e um peptídeo penetrador de neurônio
- Nanopartículas de maghemita atuam como nanozimas, melhorando o crescimento e a tolerância ao estresse abiótico em Brassica napus
- Emissão de infravermelho próximo Cr3 + / Eu3 + Co-dopado com galogermanato de zinco Nanopartículas luminescentes de persistência para imagem celular
- Nanocompósitos à base de óxido de grafeno decorados com nanopartículas de prata como agente antibacteriano
- Nanopartículas de ouro de formato redondo:efeito do tamanho da partícula e da concentração no crescimento da raiz de Arabidopsis thaliana
- Síntese in situ de nanopartículas bimetálicas de cobre e tungstênio via plasma térmico reativo de radiofrequência (RF)